How Have Currency Exchange Rates Changed
Since the Birth of the Euro?
International travel is one of the most common aspirations of American workers. Whether it's a week in Tokyo, a long weekend in Mexico City, or a summer backpacking through Europe, the experience of traveling abroad is both culturally enriching and, for many, a significant financial undertaking. One of the most underappreciated variables in the cost of international travel is the exchange rate: the price at which your dollar converts into the local currency of wherever you're headed. A favorable exchange rate can make a trip feel like a bargain; an unfavorable one can silently drain your travel budget before you've ordered your first meal.
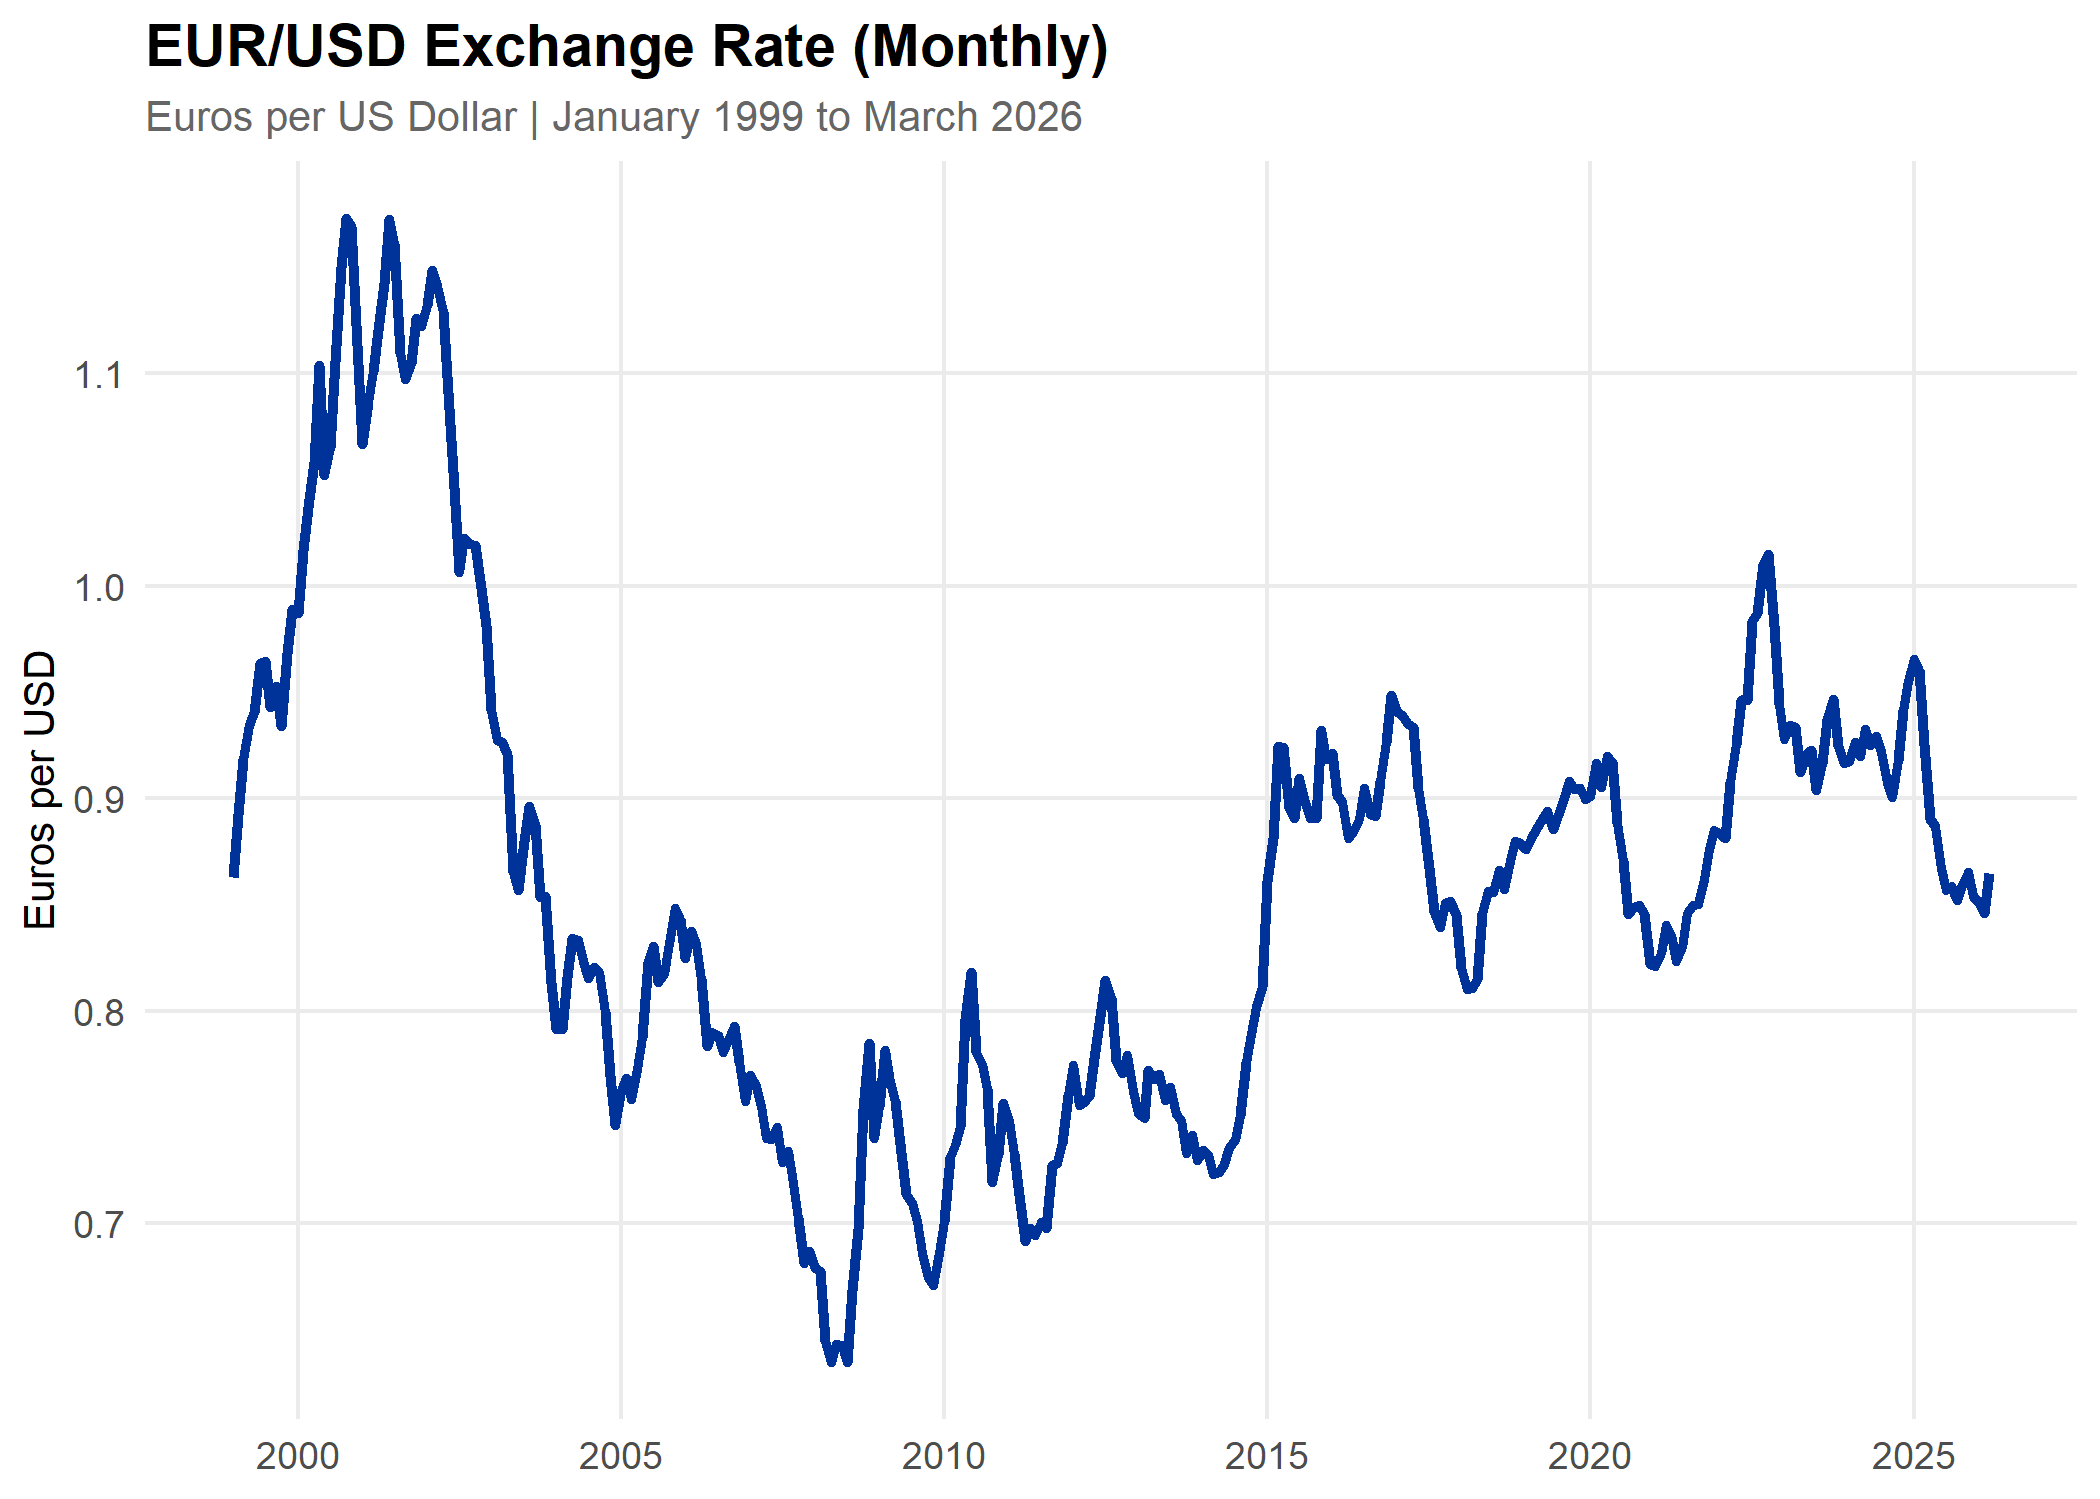
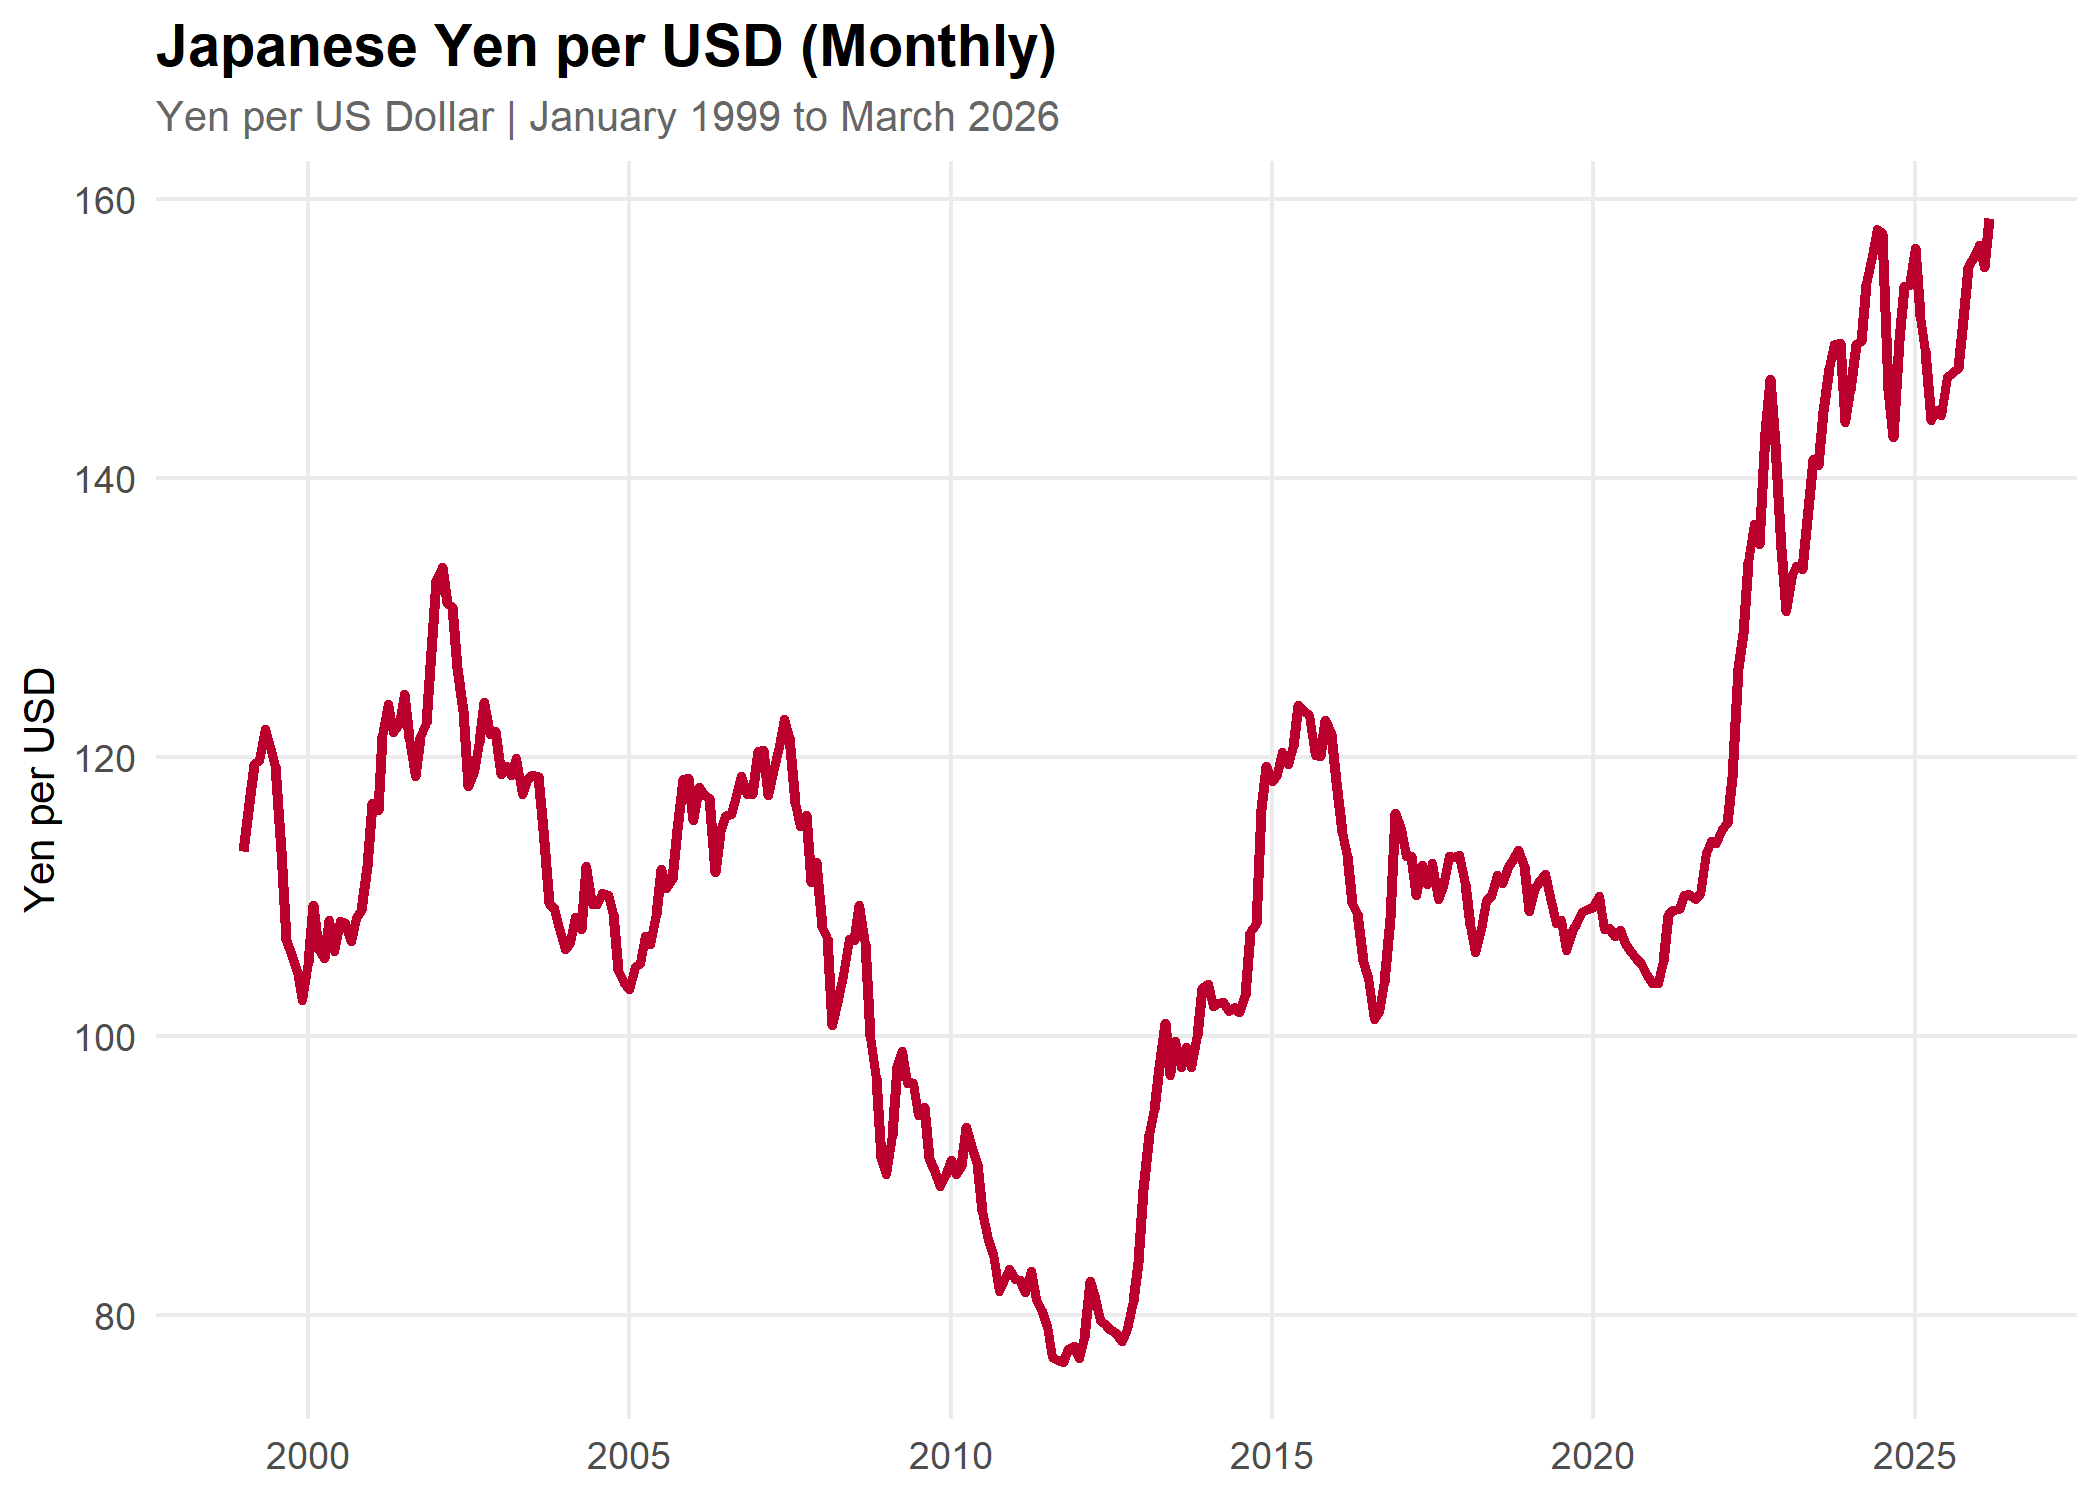
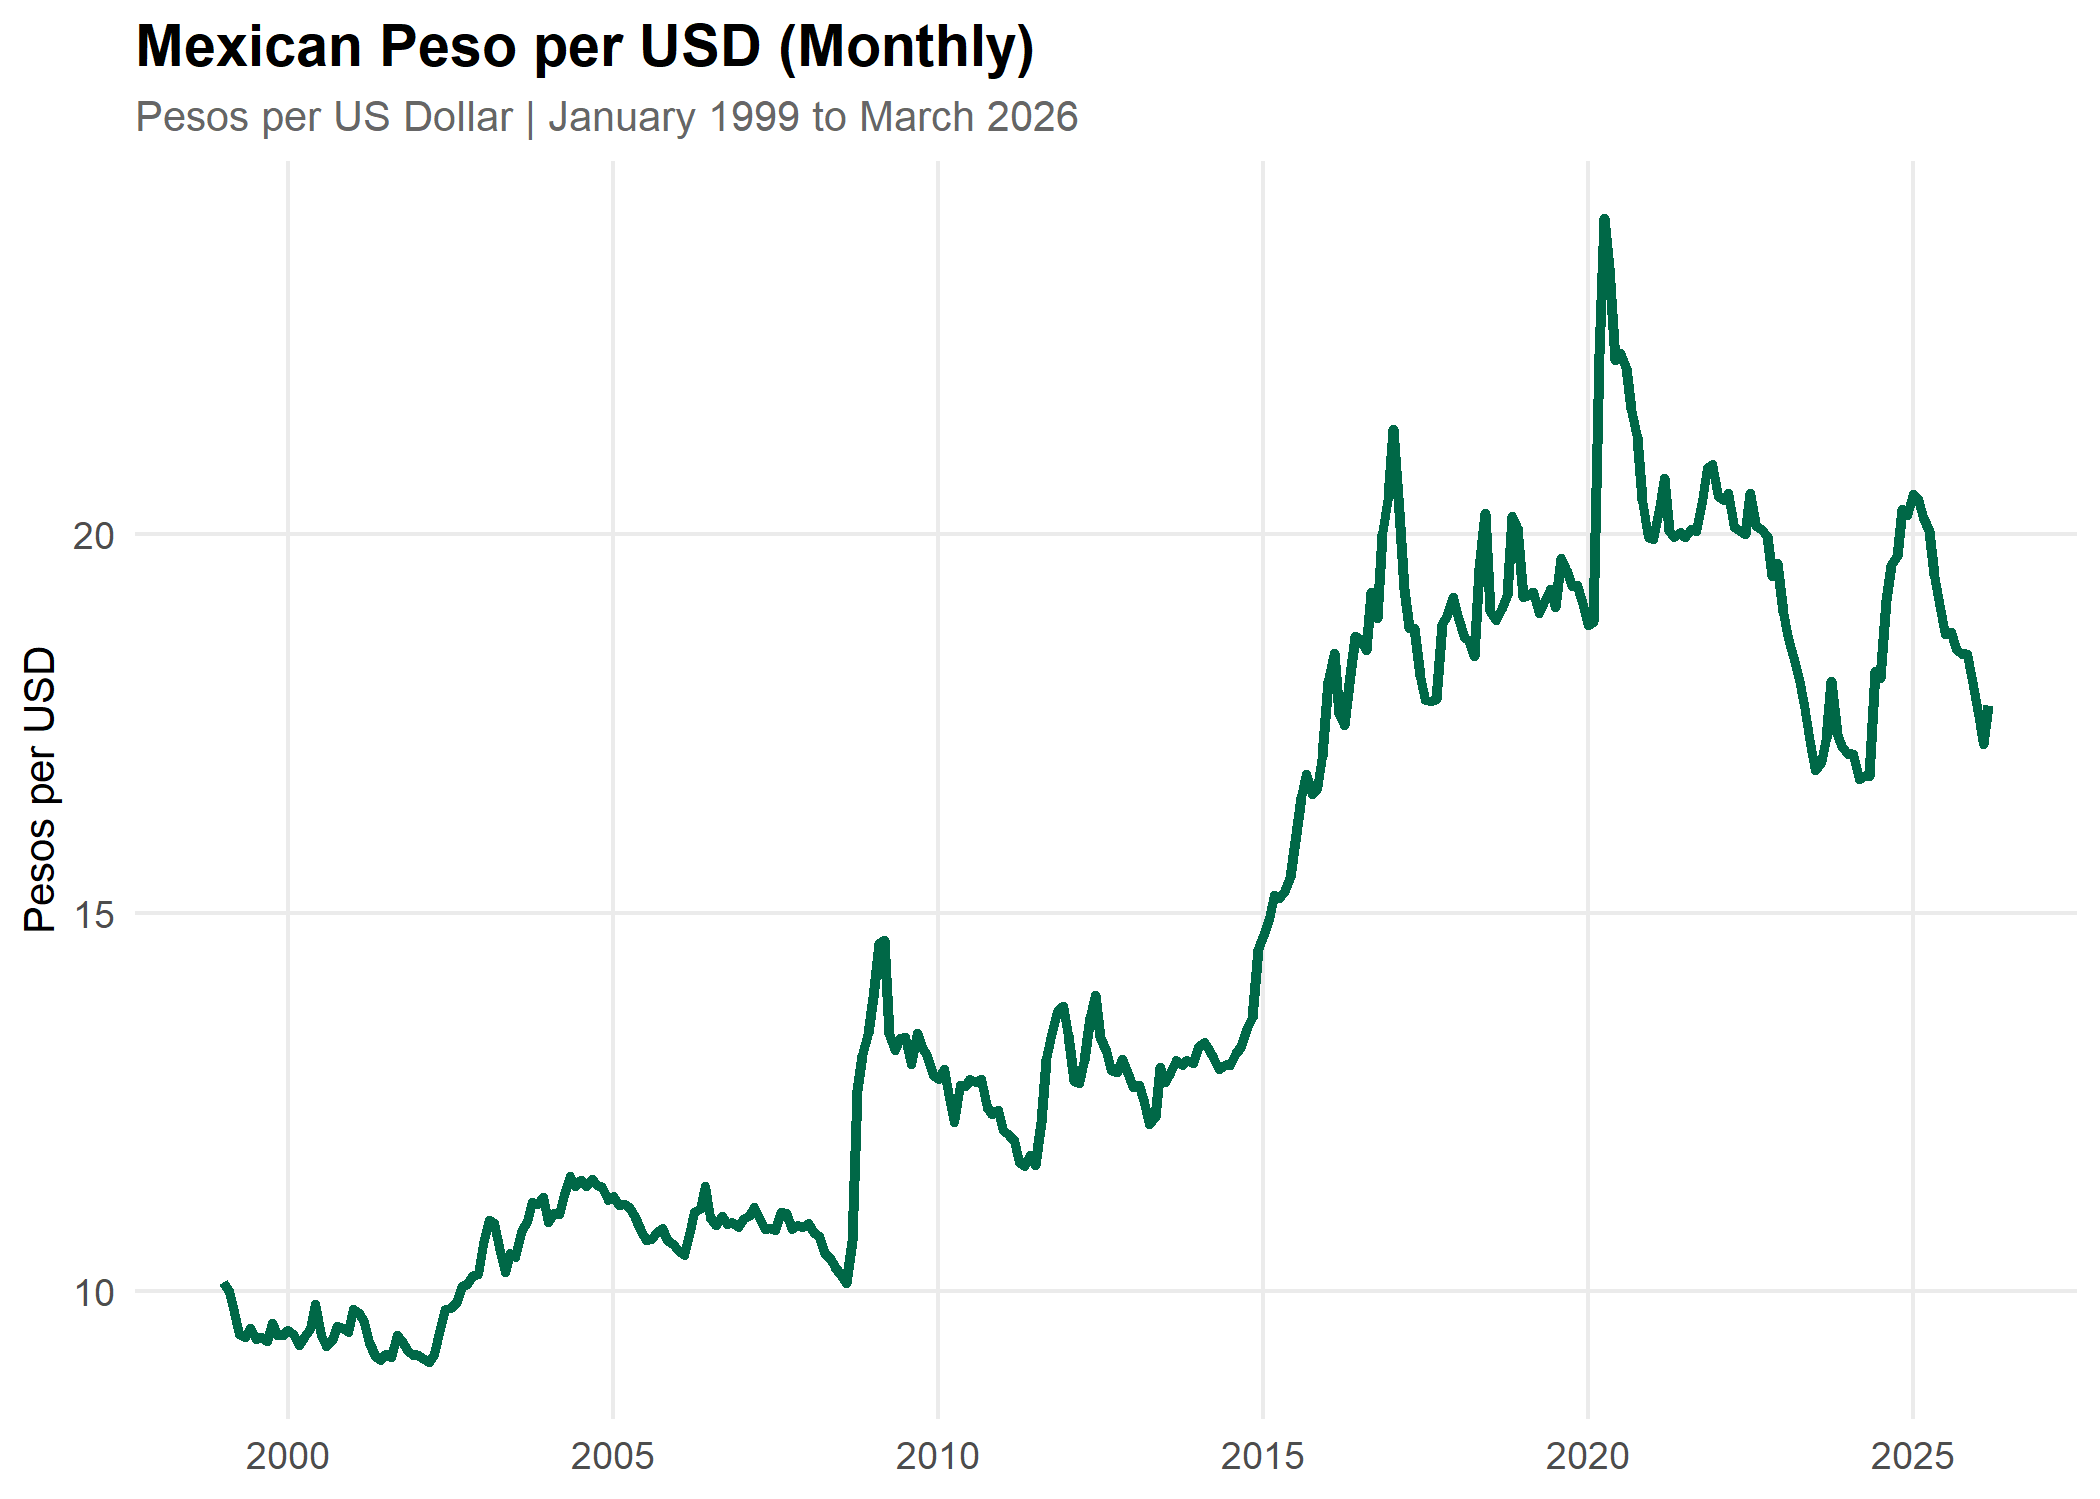
This analysis examines how currency exchange rates have shifted since the birth of the Euro in January 1999, a moment that reshaped the global currency landscape and provides a natural starting point for a multi-decade comparison. The three currencies that Americans encounter most frequently in international travel are the Euro, the Mexican Peso, and the Japanese Yen, and their individual trajectories since 1999 already tell a rich story. The analysis then expands to a wider set of countries across Europe, Latin America, and Asia.
Exchange Rate Plot Examples
A Note on Data Normalization
Looking at individual exchange rate charts is useful for tracking the history of a single currency in isolation. The problem arises when you try to compare currencies side by side. The Yen has traded between roughly 100 and 160 per dollar. The Peso has ranged from about 9 to 25. The Euro has hovered between 0.65 and 1.20. These are not comparable numbers. Plotting them on the same y-axis produces a chart that is nearly unreadable, with currencies of larger absolute values crowding out everything else.
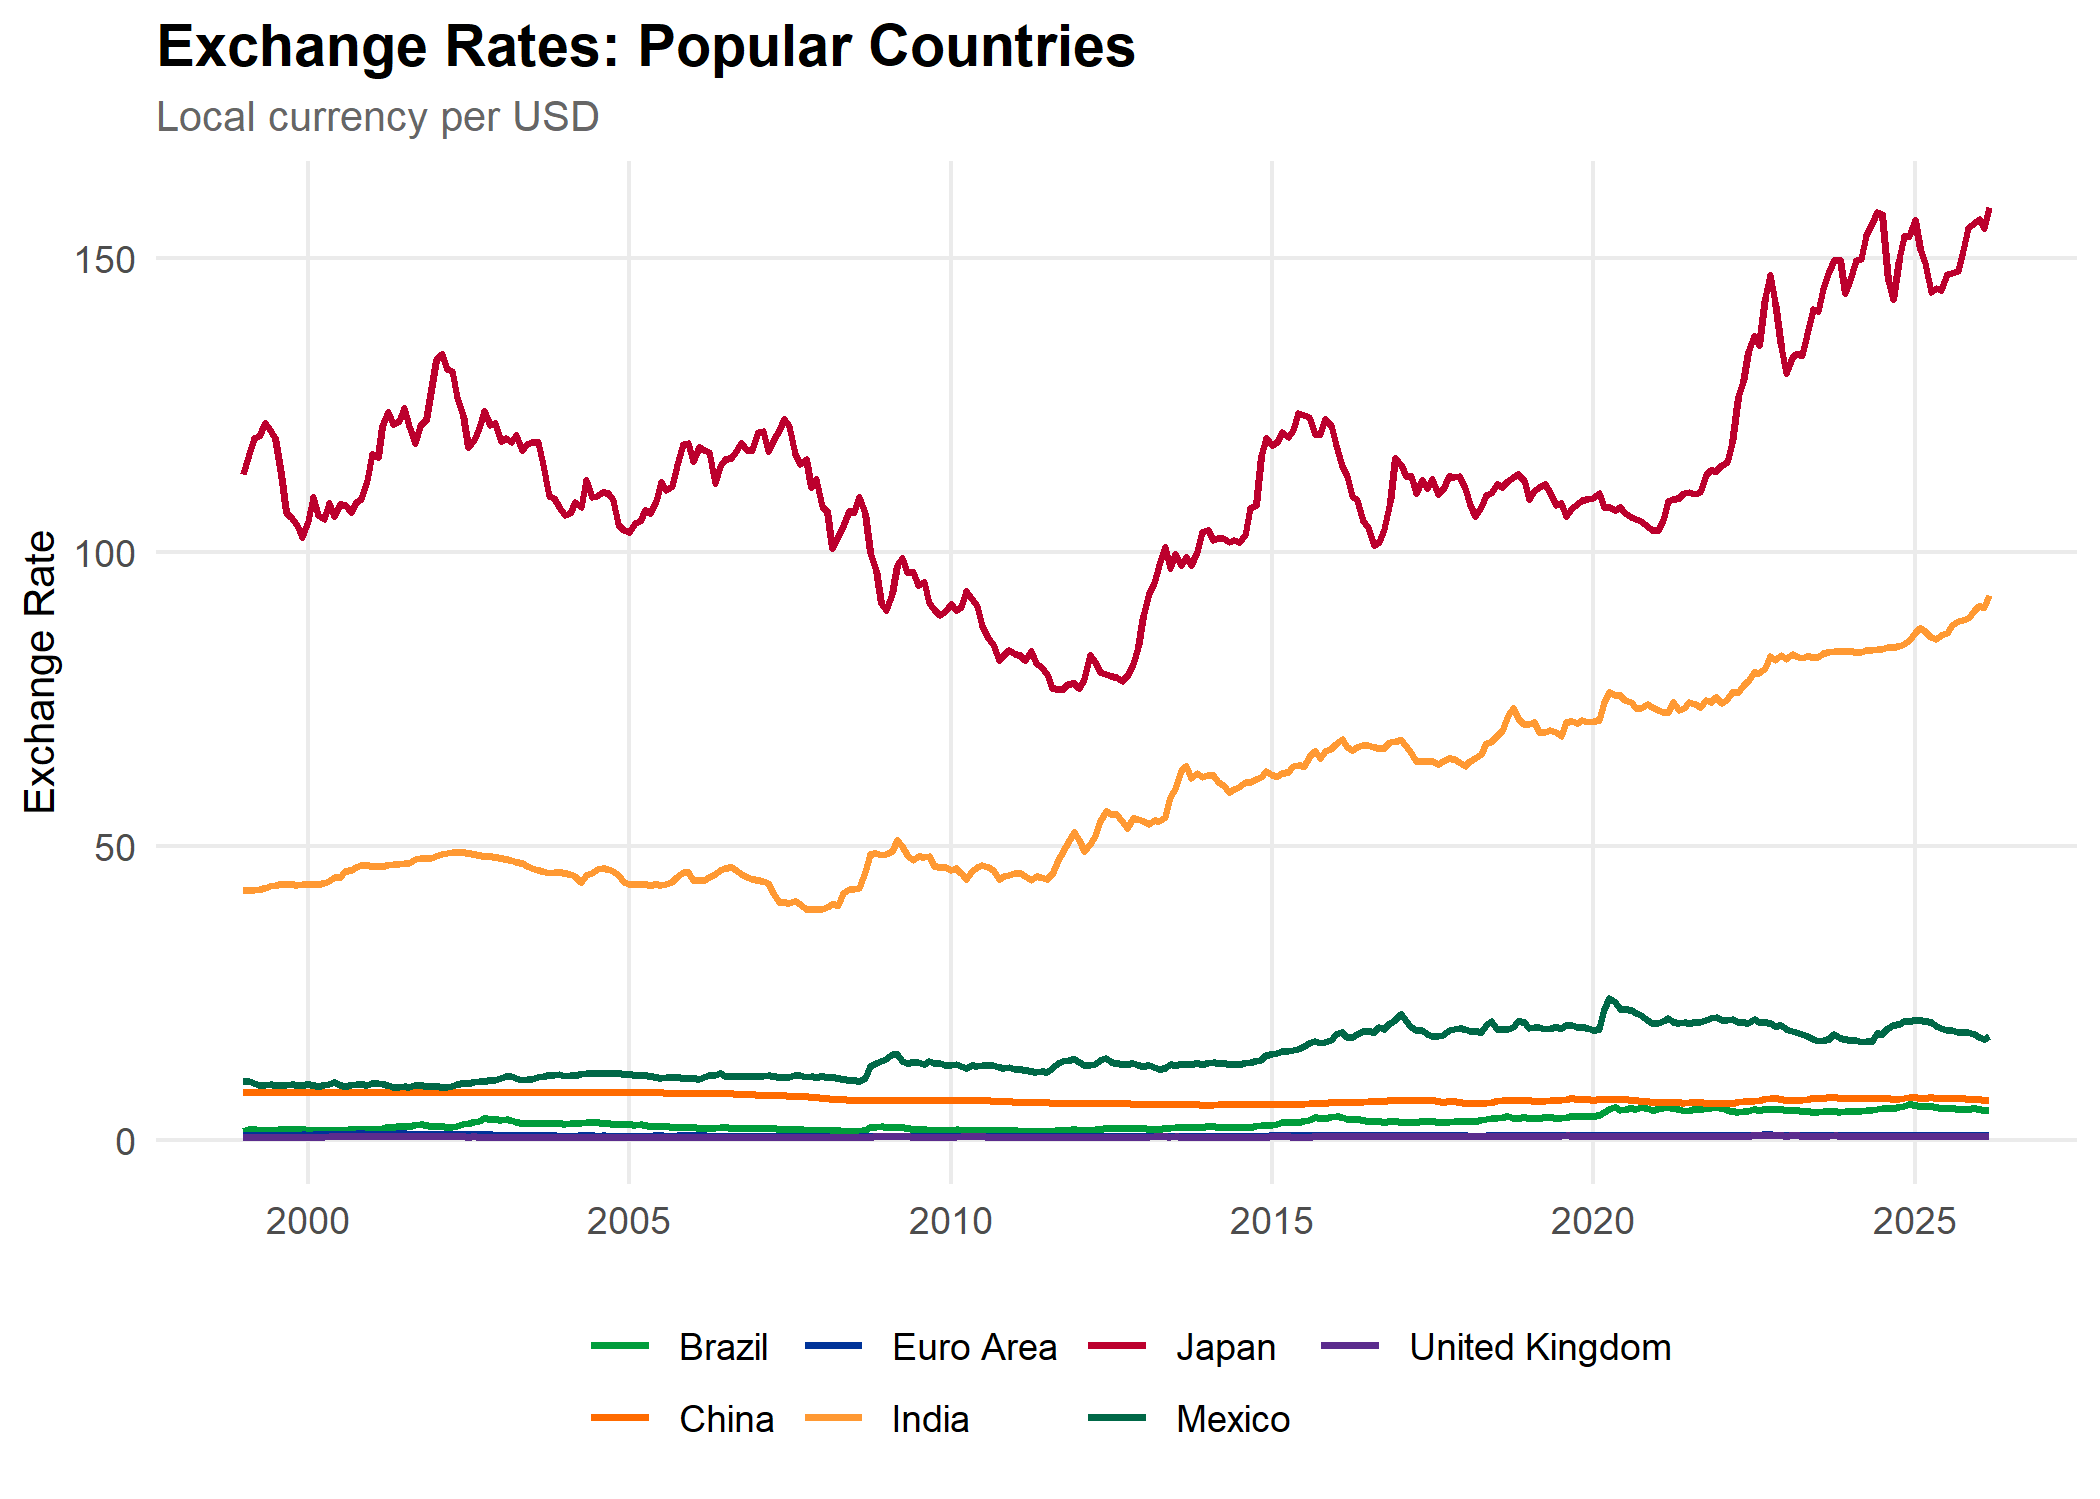
The chart above makes the problem plain. Japan dominates the y-axis entirely, and every other currency is compressed into an unreadable band at the bottom. This is why we index.
The index doesn't change the underlying exchange rate data; it simply rescales it so that all currencies start at the same point, making their trajectories directly comparable regardless of how many units per dollar each currency originally trades at. Exchange rate data is sourced from the Federal Reserve Bank of St. Louis (FRED), using monthly averages throughout.
Europe: Four Currencies, One Story, Until It Isn't
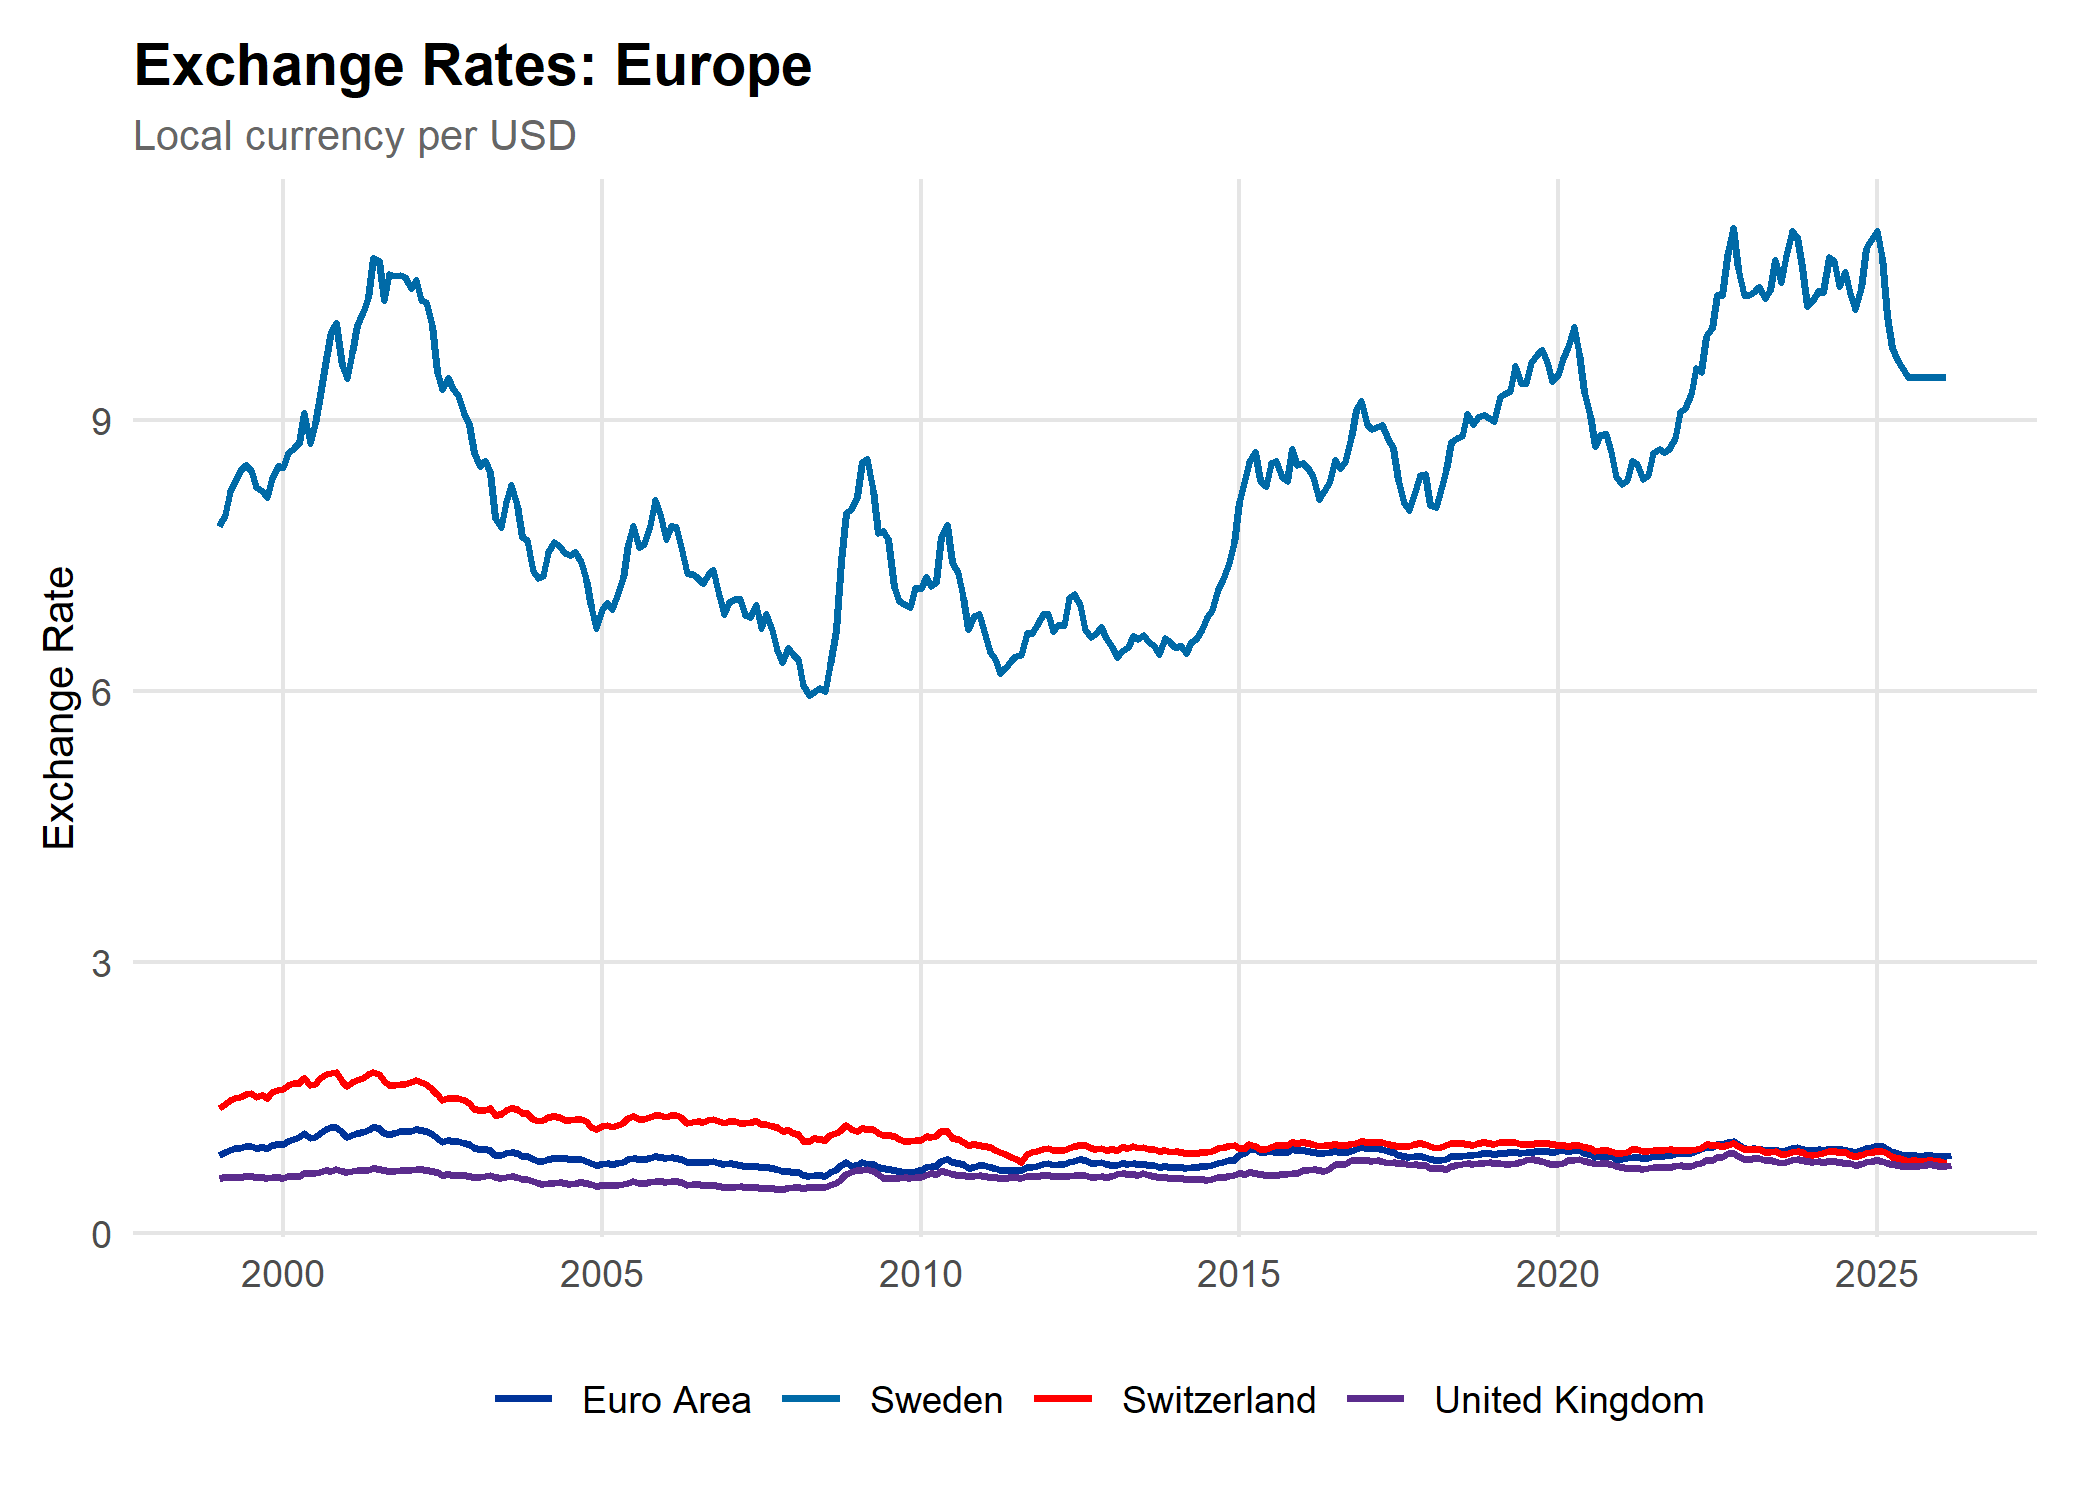
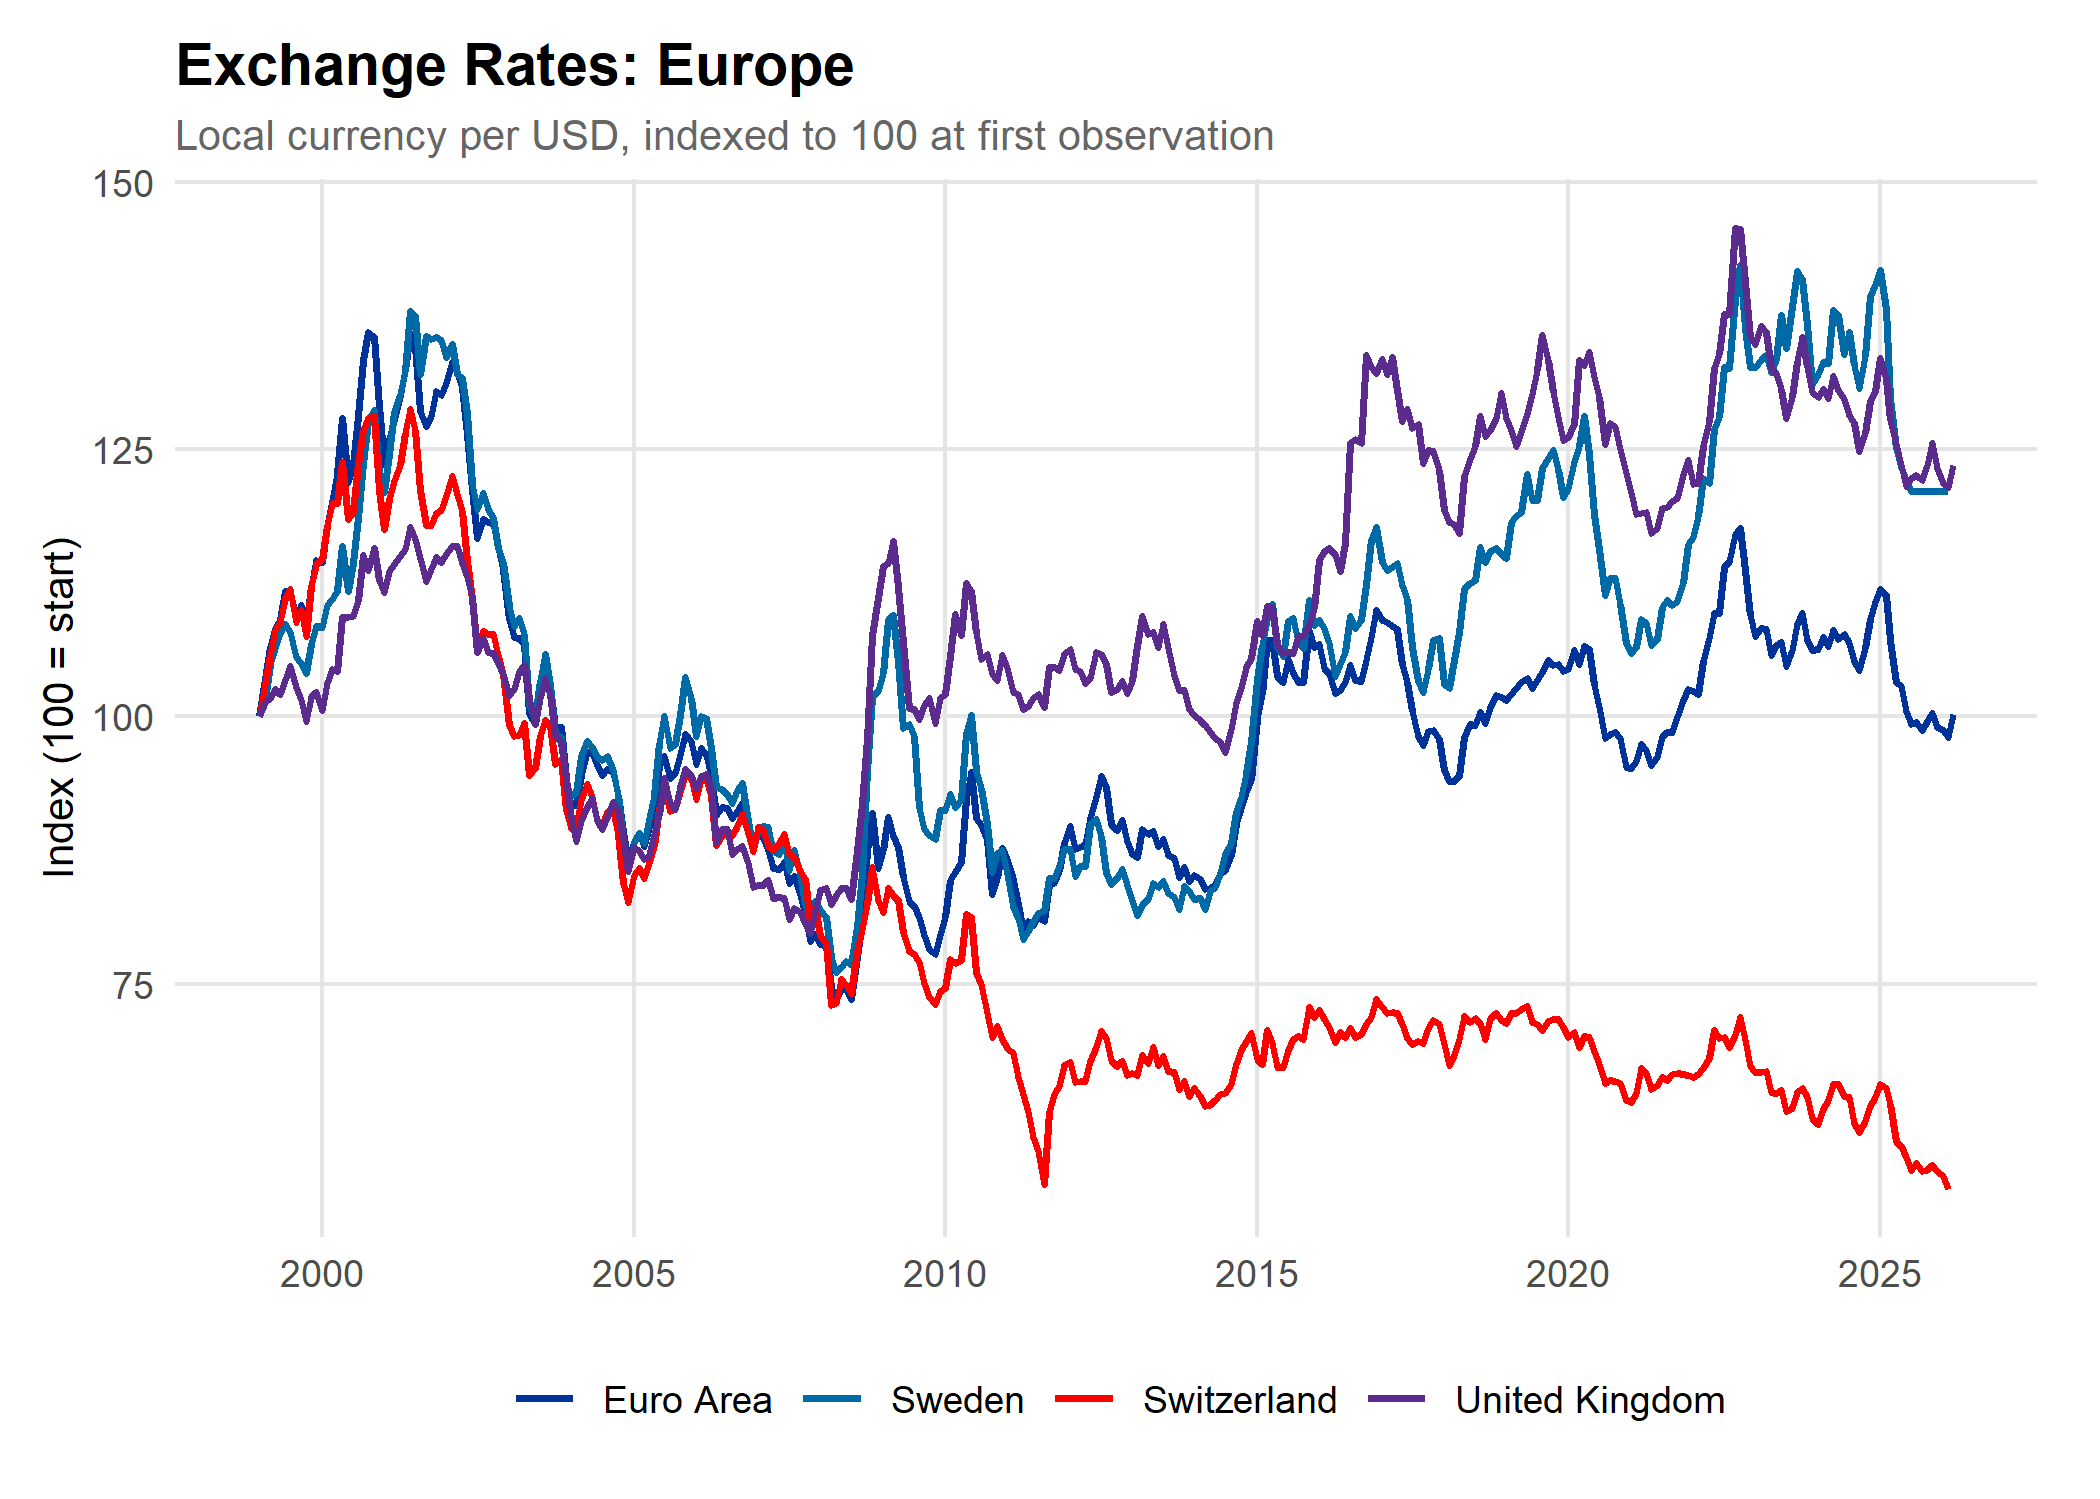
The four European currencies in this analysis (the Euro, the Swedish Kronor, the Swiss Franc, and the British Pound) all trade within a relatively tight range against the dollar. With the data indexed, a far more compelling story emerges. The early 2000s were a period of genuine dollar strength across Europe, consistent across all four currencies. This wasn't coincidental: the late 1990s tech boom had drawn massive capital flows into the United States. When the dot-com bubble burst in 2000, erasing trillions in equity value and sending the NASDAQ down roughly 78% from its peak, those capital flows reversed, and the dollar gave back much of its gains across Europe over the following years.
The decline continued through the 2008 housing crisis. When the housing market collapsed and the global financial system seized up, the dollar actually strengthened briefly. This wasn't because the US was in good shape, but because panicked investors around the world liquidated foreign assets and rushed into US Treasury securities as a safe haven. That spike is visible in the indexed data as a momentary uptick before European currencies resumed their recoveries.
Currency-by-Currency Breakdown
The Swiss Franc is the most dramatic case. It has continued a long, persistent appreciation against the dollar that began around 2001 and has never fully reversed. An American visiting Switzerland today gets meaningfully fewer francs per dollar than at any point in this dataset. The Euro, Pound, and Kronor have all oscillated within a wide band, weaker in some periods and stronger in others, but none have experienced the same relentless one-direction trend as the Franc.
COVID produced a sharp but relatively short-lived dollar weakness across Europe in 2020, as the Federal Reserve slashed rates to zero and flooded the financial system with liquidity. Three rounds of direct stimulus payments totaling nearly $931 billion, plus broader relief packages, contributed roughly 2.6 percentage points of excess inflation by early 2022. That demand surge that weakened the dollar internationally even as it temporarily boosted domestic spending.
Latin America: Boom, Bust, and Political Turbulence
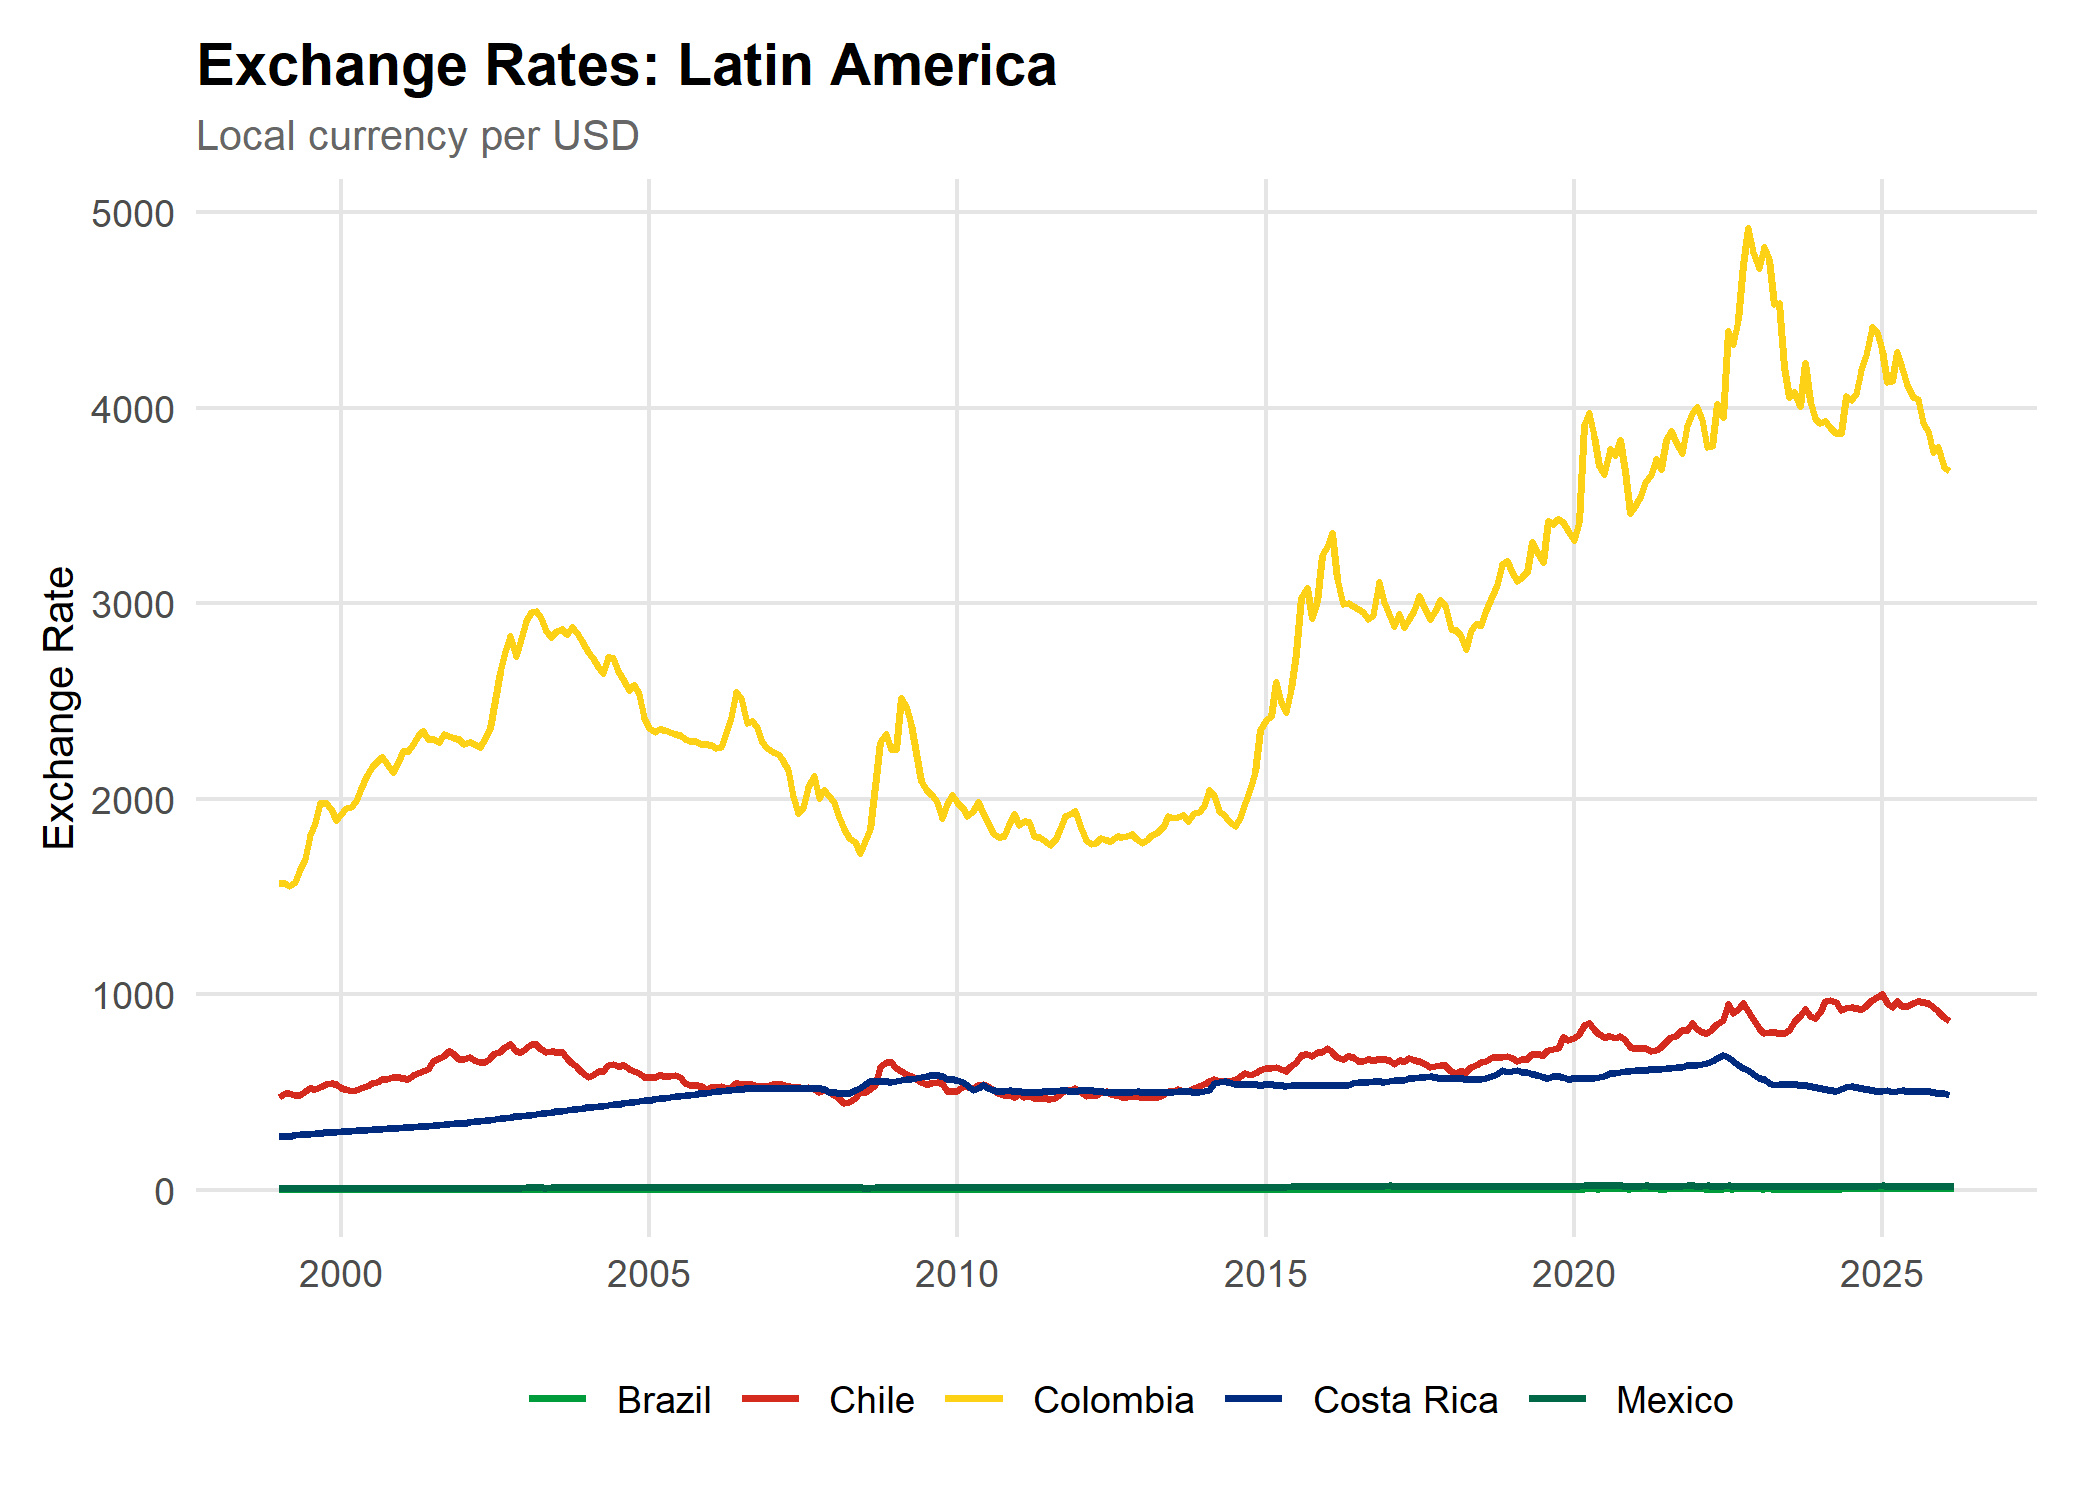
The five currencies in this region (the Brazilian Real, Mexican Peso, Chilean Peso, Colombian Peso, and Costa Rican Colón) span vastly different scales, from the Colombian Peso trading above 2,000 per dollar to the Brazilian Real above 5 per dollar. This makes the raw exchange rate chart even more difficult to interpret than Europe's, reinforcing exactly why the indexed view matters so much for this region.
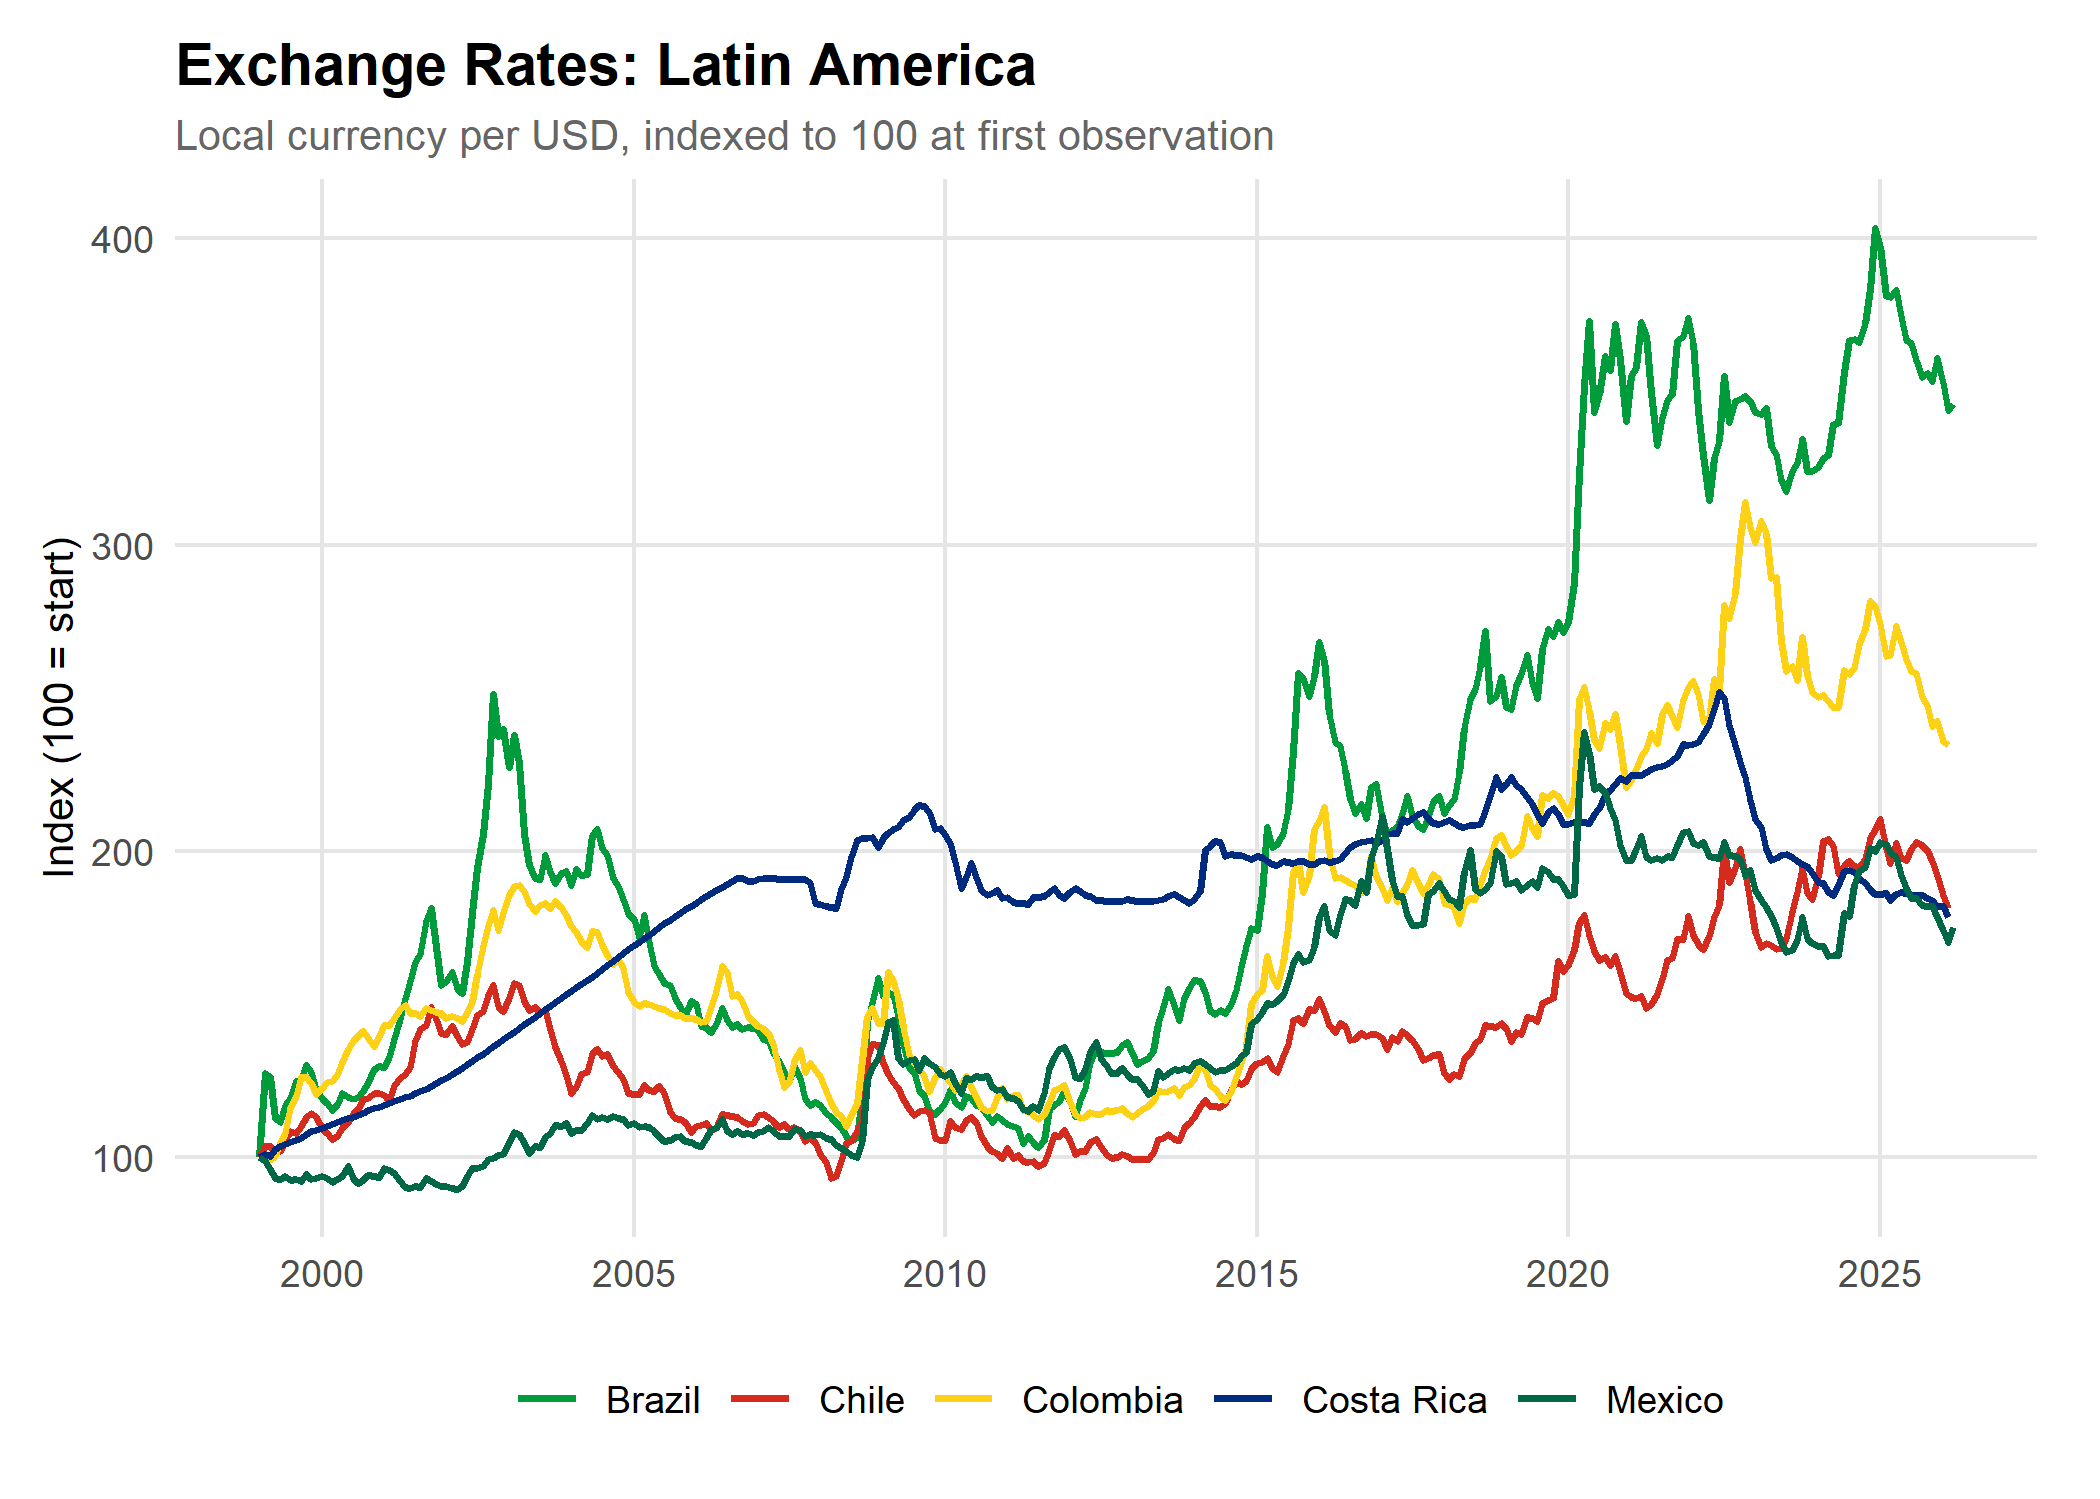
With the data indexed, the story becomes far richer. The early 2000s were a period of broad dollar strength across Latin America, driven by the same dot-com-era capital flows at work in Europe, compounded by the region's own structural vulnerabilities to US interest rate cycles and commodity price swings.
| Currency | Key Driver | Long-Run Trend vs. Dollar |
|---|---|---|
| Brazilian Real | Commodity super-cycle; political risk | Most volatile; significant depreciation overall |
| Mexican Peso | NAFTA/USMCA trade linkages | Gradual depreciation with COVID spike in 2020 |
| Chilean Peso | Copper prices | Persistent depreciation, copper provides partial backstop |
| Colombian Peso | Oil revenues; political cycles | Substantial depreciation; fiscal risks remain |
| Costa Rican Colón | Tourism & tech export revenues | Slow, consistent depreciation; least volatile in region |
Notable Stories
Brazil stands out as the most volatile currency by a wide margin. Its indexed value climbed steeply in the early 2000s around Lula's first presidential election, when markets feared a sharp left turn in fiscal policy, then staged a remarkable recovery through the commodity super-cycle of the mid-2000s. That recovery reversed sharply after 2014, culminating in the impeachment of President Dilma Rousseff in 2016 and the Petrobras corruption scandal.
Chile's Peso is particularly interesting: it has benefited visibly in recent years from elevated copper prices, which dominate Chilean exports and act as a natural currency backstop. When global copper demand rises, as it has during the energy transition buildout, the Peso tends to firm up, partially reversing the long-term depreciation trend.
The Costa Rican Colón is a notable exception to the regional pattern of episodic crises and sharp reversals. It has followed a slow, consistent depreciation path since 1999, with no sudden spikes and no dramatic recoveries. That steadiness reflects Costa Rica's comparatively stable macroeconomic fundamentals and the buffering effect of its substantial dollar-denominated tourism and tech export revenues.
Asia: The Biggest Range, The Most Divergent Stories
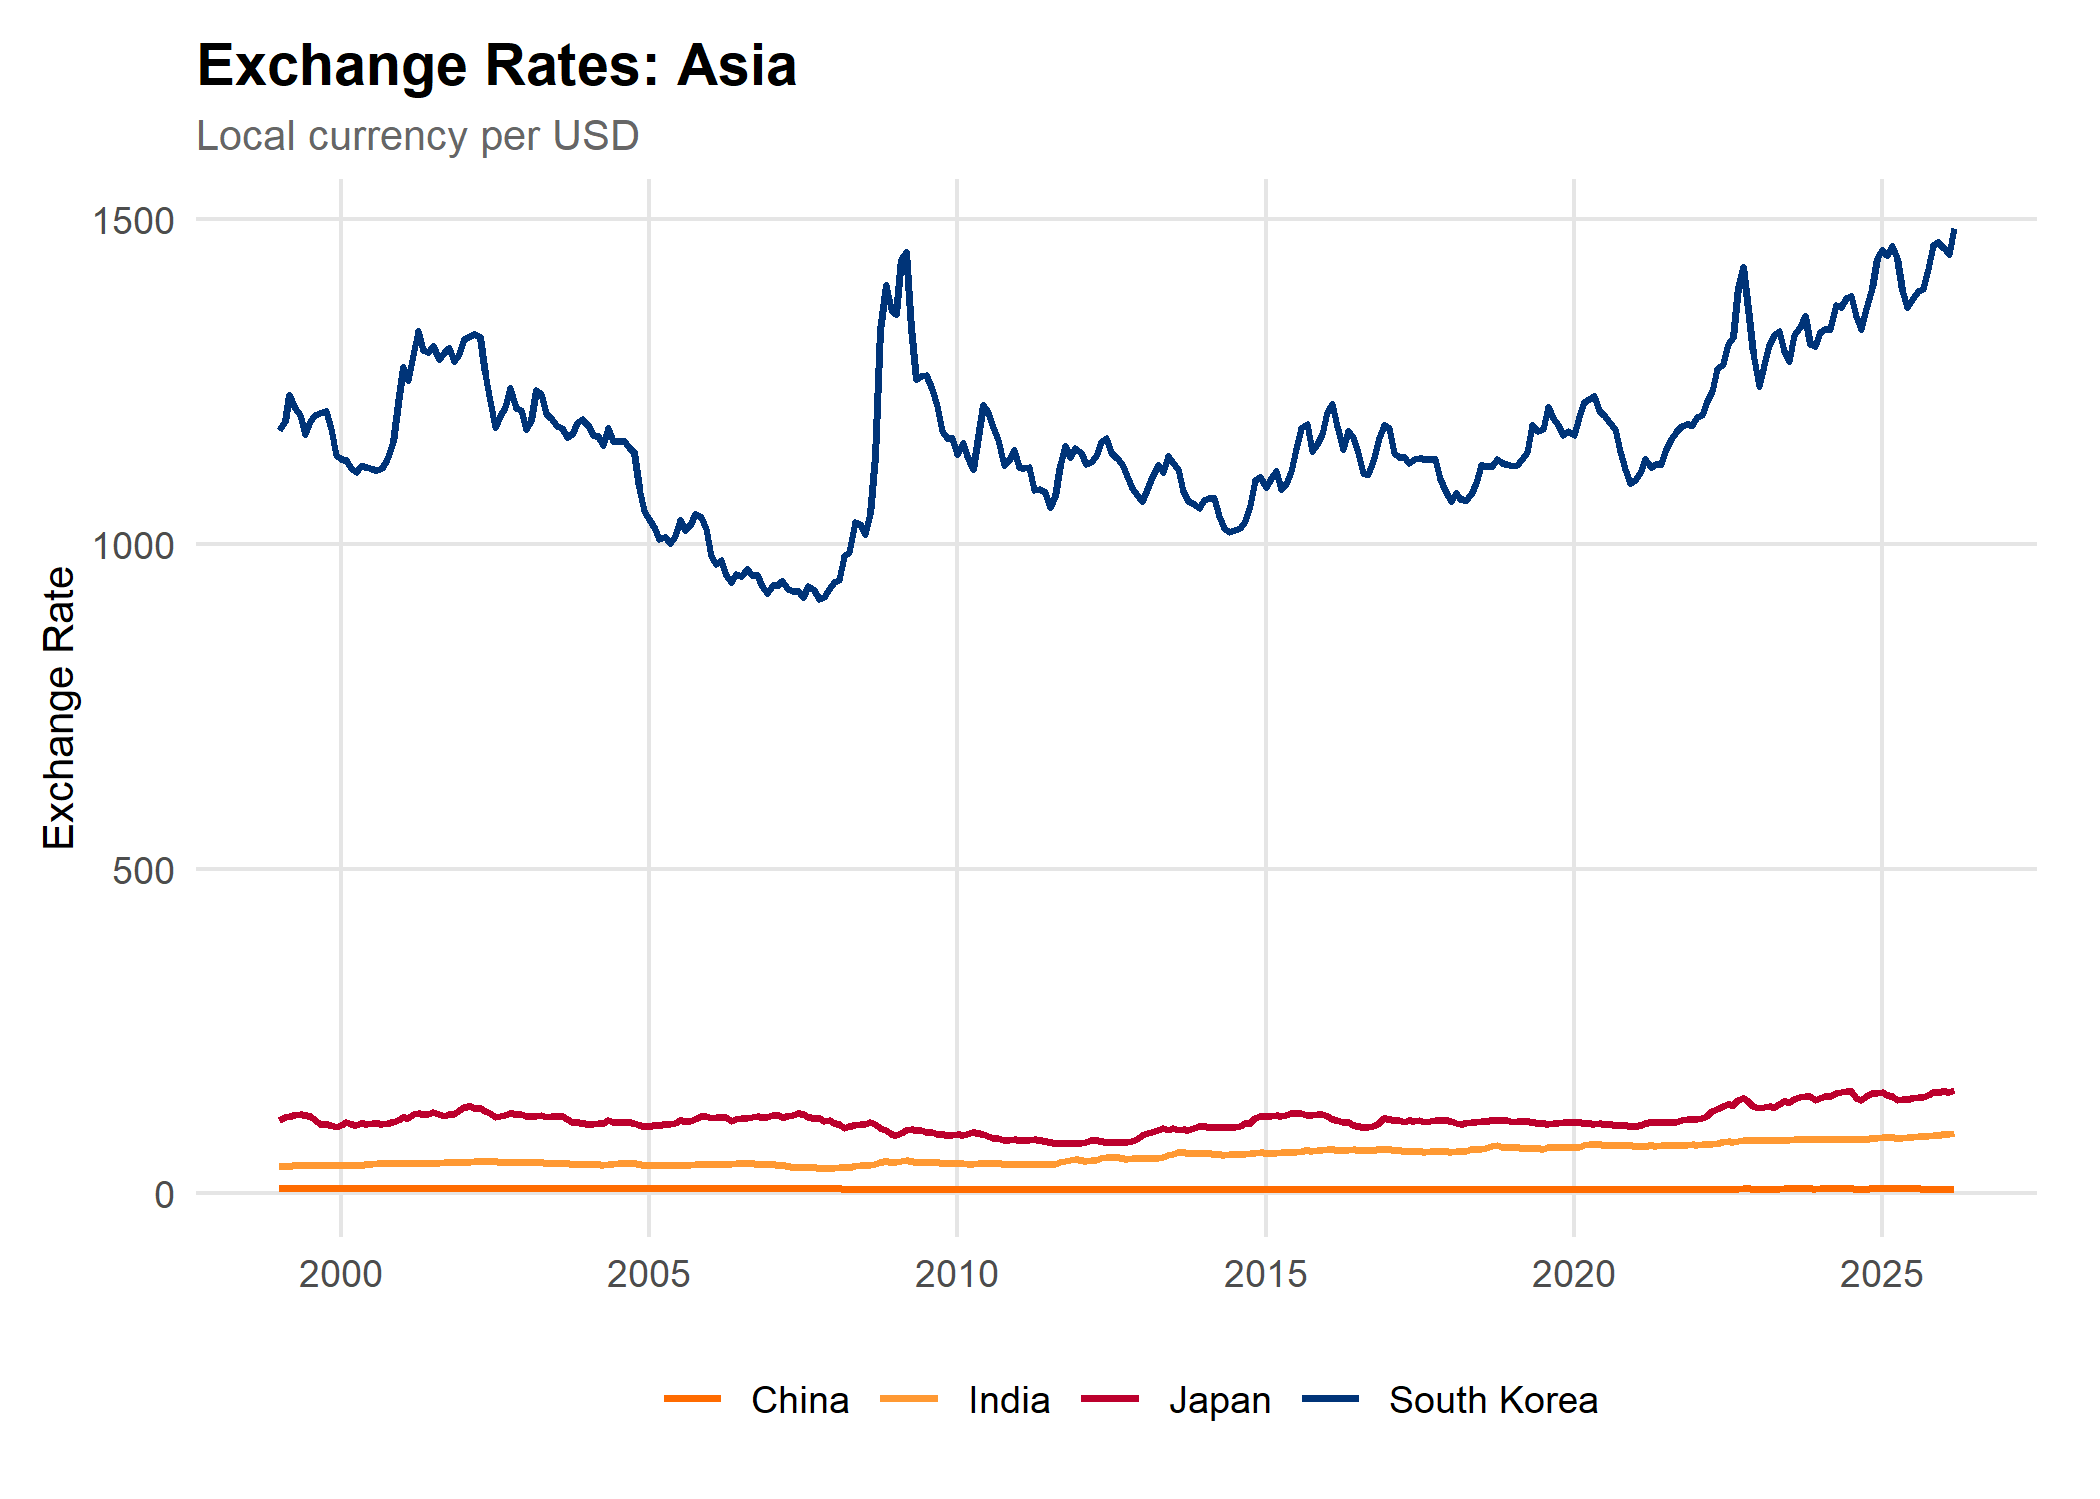
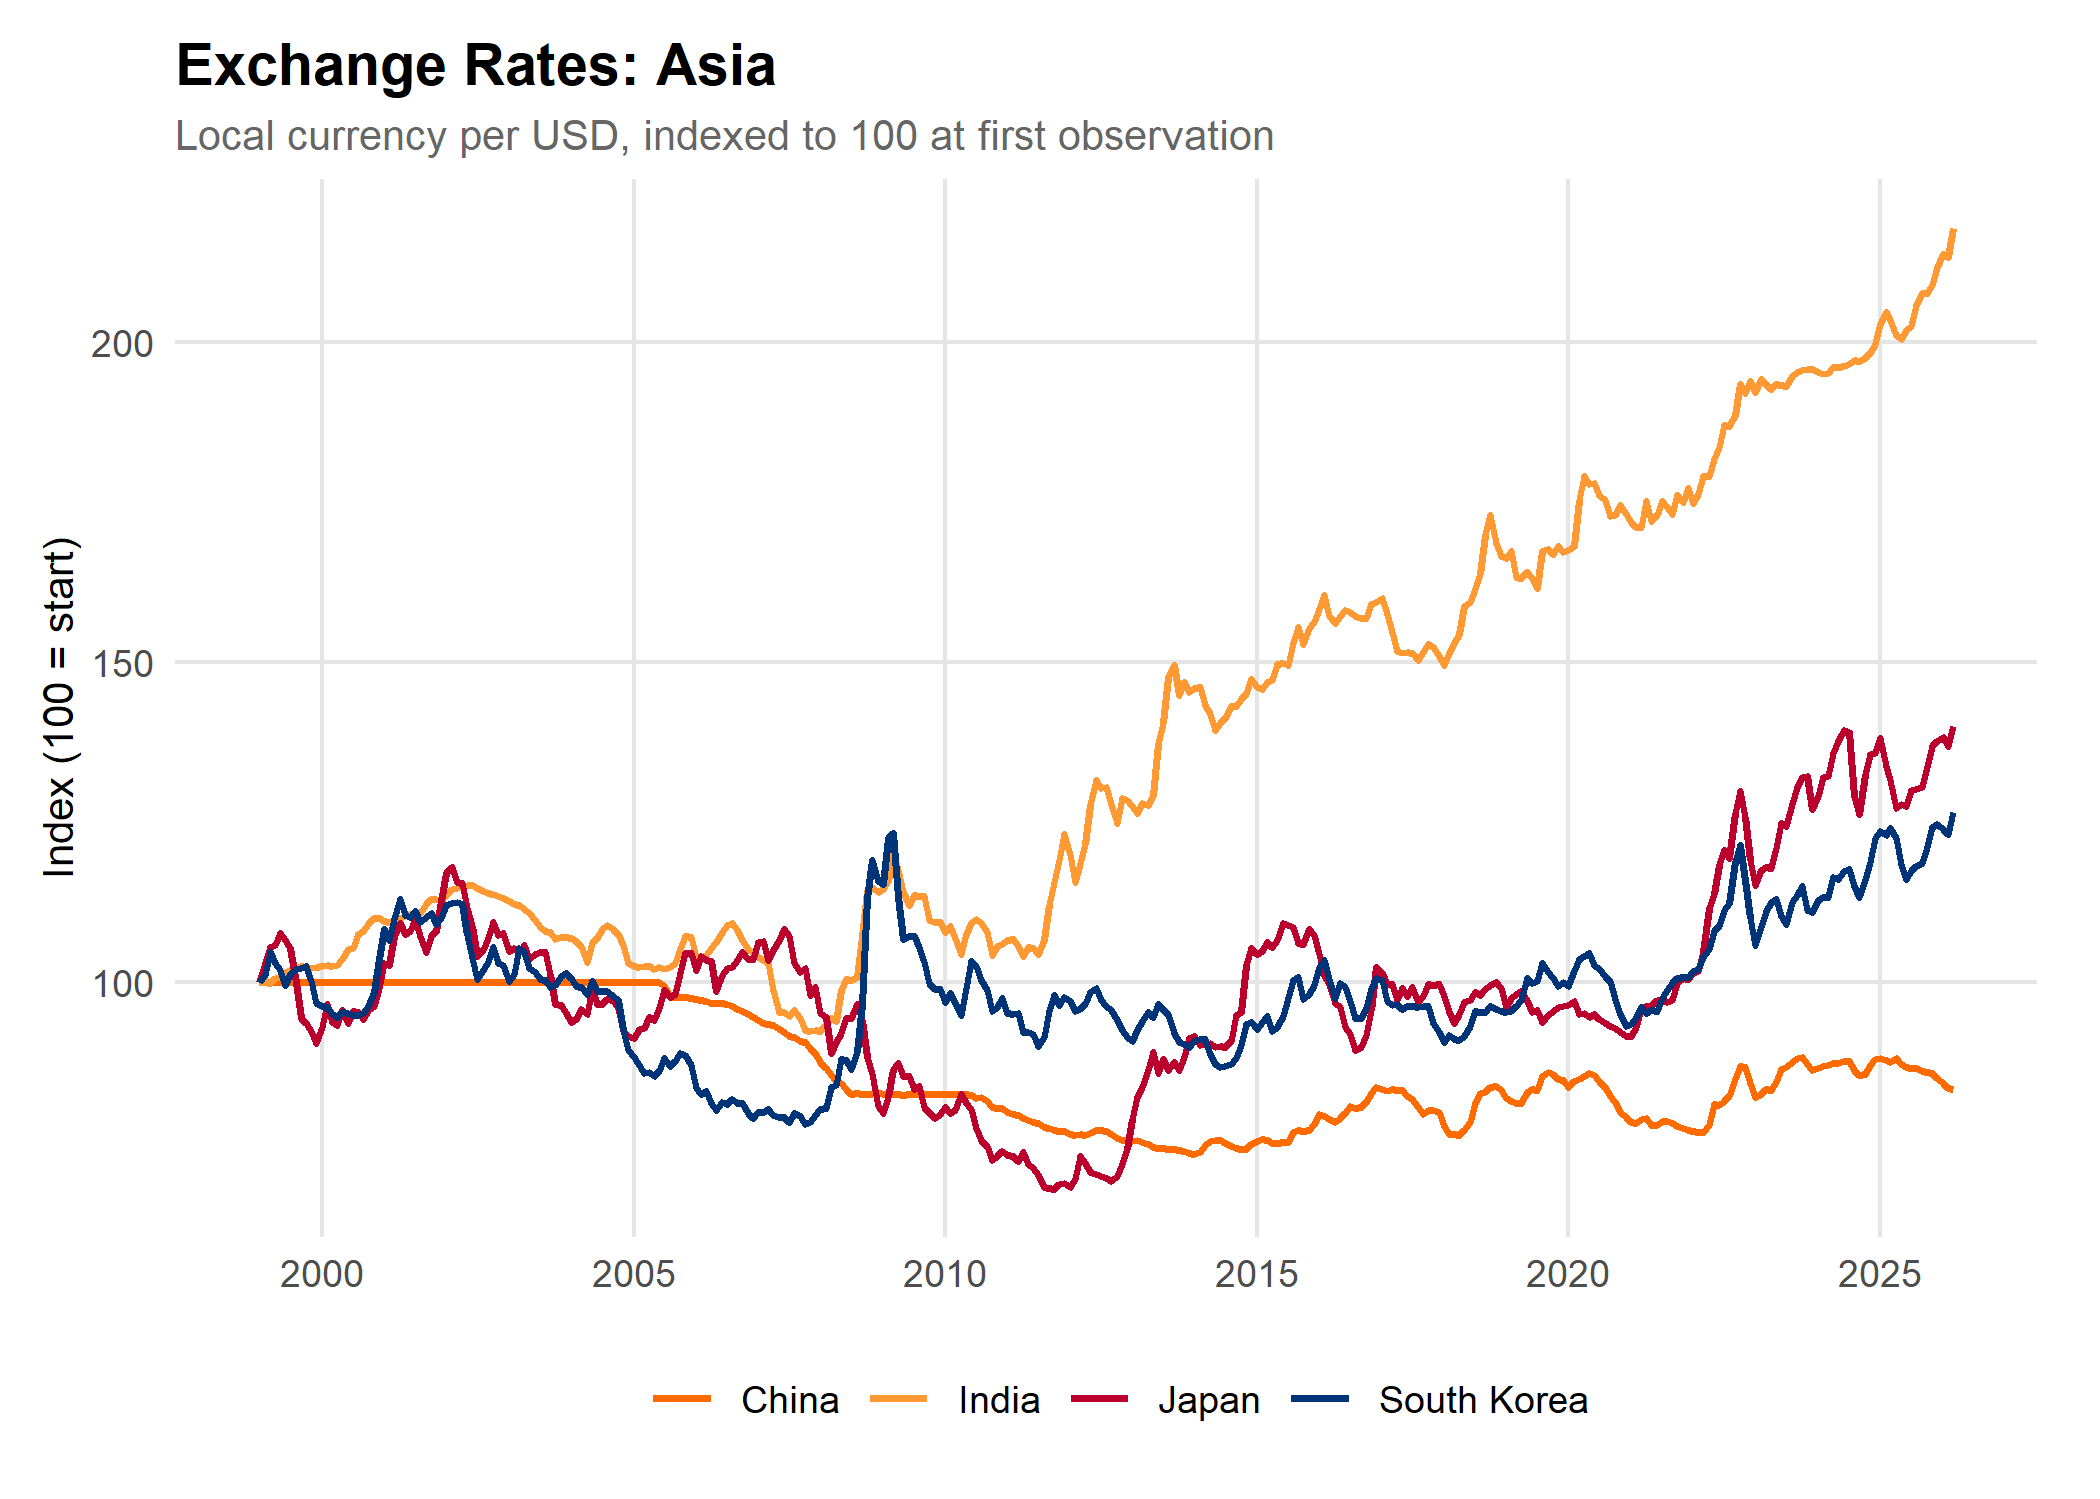
Asia presents the most extreme version of the scale problem seen across all three regions. Japan's Yen trades at roughly 150 per dollar, South Korea's Won at over 1,400, and India's Rupee near 85, while China's Yuan hovers close to 7. The indexed view reveals four genuinely distinct stories, with more divergence than either the Europe or Latin America charts produce.
| Currency | Key Feature | Long-Run Trend vs. Dollar |
|---|---|---|
| Japanese Yen | Most volatile; BoJ policy divergence | Multi-decade lows in early 2020s; now showing signs of recovery |
| Chinese Yuan | Government-managed peg until 2005 | Modest net appreciation; tightly managed by PBoC |
| Indian Rupee | Structural inflation differential | Slow, steady depreciation; India progressively more affordable for Americans |
| South Korean Won | Deep global trade integration | Meaningful depreciation; far more volatile than Rupee |
The Japan Story
Japan's Yen is the most volatile of the four in indexed terms, and the swings are large enough to matter enormously for American travelers. The Yen strengthened sharply after the 2008 crisis, driven by the classic safe-haven dynamic. That strength reversed dramatically after 2013, when Prime Minister Shinzo Abe's government launched "Abenomics," centered on aggressive monetary easing that deliberately weakened the yen to boost export competitiveness. The Yen never fully recovered and has been trending weaker since, hitting multi-decade lows in the early 2020s as the Bank of Japan held rates near zero while every other major central bank hiked aggressively to fight post-pandemic inflation.
China's Yuan tells an unusual story. For the first six years of this dataset, the line is almost perfectly flat. China maintained a strict peg of approximately 8.28 yuan per dollar from 1994 until July 2005, when Beijing bowed to sustained international pressure. From 2005 onward, the Yuan appreciated steadily until around 2014, then weakened again as China's growth model came under pressure.
What Does the Future Hold for the US Dollar?
The data presented throughout this analysis tells a story of the past 26 years, but what does the road ahead look like for American travelers? The picture is one of broad but uneven dollar weakness, with meaningful variation by region and by the specific forces driving each local currency.
Summary Outlook by Currency
| Region | Currency | Outlook for Americans |
|---|---|---|
| Europe | Euro | Less favorable; dollar expected to weaken |
| Europe | British Pound | Slightly less favorable; pound well-supported |
| Europe | Swiss Franc | Unfavorable; already expensive, structural strength continues |
| Europe | Swedish Kronor | Modest dollar weakness expected |
| Latin America | Mexican Peso | Roughly stable; USMCA uncertainty limits Peso upside |
| Latin America | Brazilian Real | Moderate; high yields support Real, but election risk in Oct 2026 |
| Latin America | Chilean Peso | Less favorable; copper prices strengthening the Peso |
| Latin America | Colombian Peso | Roughly stable; election uncertainty adds volatility |
| Latin America | Costa Rican Colón | Roughly stable; gradual slow depreciation trend continuing |
| Asia | Japanese Yen | Less favorable; Yen recovery underway as BoJ hikes rates |
| Asia | Chinese Yuan | Roughly stable; tightly managed by PBoC |
| Asia | Indian Rupee | Modestly less favorable; oil deficit pressuring currency |
| Asia | South Korean Won | Roughly stable; competing forces roughly balanced |
Europe: Less Bang for the Dollar
For Americans traveling to Europe, the outlook is generally unfavorable. The euro is expected to continue strengthening as the interest rate differential between the Fed and the European Central Bank narrows. Germany's major fiscal expansion into infrastructure and defense spending is providing a new growth engine for the euro area. The Swiss Franc, already the worst-performing currency for American travelers in the historical data, is projected to remain strong; ABN AMRO notes the dollar is actually undervalued relative to the franc by about 19% on a purchasing power parity basis.
Latin America: A Mixed Picture Dominated by Politics
Mexico faces meaningful headwinds from the ongoing renegotiation of USMCA, which has created sustained policy uncertainty weighing on foreign direct investment and the Peso. Most forecasts project USD/MXN in the 17.80–19.00 range through 2026. Brazil's central bank hiked rates aggressively in 2025, giving the Real one of the highest nominal yields in the world and providing some support, but a presidential election in October 2026 introduces historical fiscal risk and currency volatility. Chile's Peso has a more favorable near-term outlook than most regional peers, largely due to elevated copper prices, which is not great news for American travelers heading to Santiago or Patagonia.
Asia: The Yen's Potential Comeback
Japan's Yen has been the standout underperformer of the past several years and may be approaching an inflection point. The Bank of Japan raised its policy rate twice in 2025 (the first meaningful hikes since 2007), bringing the rate to 0.75%. Analysts widely expect further hikes in 2026, which would narrow the interest rate differential with the US that has been the primary driver of Yen weakness. For Americans, this is arguably the most significant development to watch: Japan has been extraordinarily affordable for American travelers over the past two years due to Yen weakness, and that window may be beginning to close.
Final Thoughts
The overarching story of this analysis is that the era of an exceptionally strong US dollar, which made international travel unusually affordable for Americans from roughly 2022 through early 2025, appears to be fading. The structural case for a weaker dollar in 2026 and beyond rests on narrowing interest rate differentials, dollar overvaluation relative to most major currencies, and a gradual reassessment of US fiscal sustainability. The Federal Reserve's rate path remains the single most important driver: MUFG Research anticipates the Fed cutting rates three times in 2026, projecting EUR/USD ending the year near 1.24, implying fewer euros per dollar and a meaningfully more expensive trip to Europe.
For Americans planning international travel, particularly to Japan and Europe, the window of favorable exchange rates may be shorter than it appears. The best advice the data can offer is straightforward: if you've been waiting to pull the trigger on that trip to Tokyo or Rome, the math may not get more favorable from here.
Notes & Sources
- Exchange rate data sourced from the Federal Reserve Bank of St. Louis (FRED). Monthly averages are used throughout. Series identifiers: DEXUSEU (Euro), DEXMXUS (Mexican Peso), DEXJPUS (Japanese Yen). https://fred.stlouisfed.org
- This is a well-documented challenge in multi-currency financial analysis. Indexing to a common base period is the standard methodological approach. See Neely, C.J. and Weller, P.A., "Technical Analysis in the Foreign Exchange Market," Federal Reserve Bank of St. Louis Review, 2011. https://research.stlouisfed.org/publications/review/2011/09/01/technical-analysis-in-the-foreign-exchange-market/
- Wikipedia, Dot-com bubble. https://en.wikipedia.org/wiki/Dot-com_bubble
- BIS Quarterly Review, Dollar appreciation in 2008: safe haven, carry trades, dollar shortage. Bank for International Settlements, December 2009. https://www.bis.org/publ/qtrpdf/r_qt0912i.pdf
- U.S. Government Accountability Office, Stimulus Checks: Direct Payments to Individuals during the COVID-19 Pandemic (April 2022). https://www.gao.gov/products/gao-22-106044
- Federal Reserve Bank of St. Louis, Fiscal Policy and Excess Inflation During Covid-19: A Cross-Country View (July 2022). https://www.federalreserve.gov/econres/notes/feds-notes/fiscal-policy-and-excess-inflation-during-covid-19-a-cross-country-view-20220715.html
- Council on Foreign Relations, Currency Crises in Emerging Markets (2015). https://www.cfr.org/backgrounder/currency-crises-emerging-markets
- The Real lost roughly 30% of its value in the months surrounding the 2002 Brazilian presidential election, reflecting investor anxiety about Lula's campaign promises. The currency recovered after Lula's government signaled commitment to fiscal discipline. See: International Monetary Fund, Brazil: 2003 Article IV Consultation (2003).
- Federal Reserve Bank of St. Louis, Mexican Pesos to U.S. Dollar Spot Exchange Rate (DEXMXUS). https://fred.stlouisfed.org/series/DEXMXUS
- Chile accounts for roughly 27% of global copper production. See: U.S. Geological Survey, Mineral Commodity Summaries: Copper (2024). https://pubs.usgs.gov/periodicals/mcs2024/mcs2024-copper.pdf
- The 1997–98 Asian financial crisis began with Thailand's currency collapse and spread rapidly to South Korea, Indonesia, and other economies. South Korea required a $58 billion IMF bailout, at the time the largest in IMF history. The Won lost roughly half its value in a matter of months. See: International Monetary Fund, The Asian Crisis: Causes and Cures, Finance & Development, June 1998.
- U.S. Treasury Department, Report to Congress on International Economic and Exchange Rate Policies (2005). The Treasury had repeatedly declined to formally label China a currency manipulator, but the political pressure contributed to China's July 2005 decision to revalue the yuan by 2.1% and shift to a managed float. https://home.treasury.gov/system/files/206/2005-11-ForeignExchangeReport.pdf
- BIS Quarterly Review, Dollar appreciation in 2008: safe haven, carry trades, dollar shortage. Bank for International Settlements, December 2009. https://www.bis.org/publ/qtrpdf/r_qt0912i.pdf
- Bank of Japan, Introduction of "Quantitative and Qualitative Monetary Easing" (April 2013). The BoJ announced it would double Japan's monetary base within two years, which contributed to the yen declining more than 30% against the dollar between 2012 and 2015. https://www.boj.or.jp/en/mpc/mpmdeci/mpm_2013/k130404a.pdf
- ABN AMRO, FX Outlook 2026: More Dollar Weakness Ahead (2025). https://www.abnamro.com/research/en/our-research/fx-outlook-2026-more-dollar-weakness-ahead
- MUFG Research, FX Focus: G10 FX 2026 Outlook (December 2025). https://www.mufgresearch.com/fx/fx-focus-g10-fx-2026-outlook-in-a-post-peak-usd-world-19-december-2025/
- ABN AMRO, FX Outlook 2026: More Dollar Weakness Ahead (2025). https://www.abnamro.com/research/en/our-research/fx-outlook-2026-more-dollar-weakness-ahead
- Cambridge Currencies, US Dollar Forecast 2026 (March 2026). https://cambridgecurrencies.com/usd-forecast-2026/
- Americas Market Intelligence, The 2026 Regional Outlook for Latin America (December 2025). https://americasmi.com/insights/latin-america-2026-economic-outlook/
- ING Think, LatAm FX Outlook 2026: Full Metal Jacket (November 2025). https://think.ing.com/articles/latam-fx-outlook-2026/
- ING Think, LatAm FX Outlook 2026: Full Metal Jacket (November 2025). https://think.ing.com/articles/latam-fx-outlook-2026/
- KPMG, LatAm Q1 2026 Outlook (February 2026). https://kpmg.com/us/en/articles/2026/latam-q1-2026-outlook.html
- ING Think, LatAm FX Outlook 2026: Full Metal Jacket (November 2025). https://think.ing.com/articles/latam-fx-outlook-2026/
- J.P. Morgan Private Bank Latin America, Latin America in 2026: Between Promise and Pressure (January 2026). https://privatebank.jpmorgan.com/latam/en/insights/markets-and-investing/ideas-and-insights/latin-america-in-2026-between-promise-and-pressure-the-answer-is-optionality
- Forex.com, USD/JPY in 2026: Can the Yen Finally Start to Shine? (December 2025). https://www.forex.com/en-us/news-and-analysis/usdjpy-in-2026-can-the-yen-finally-start-to-shine/
- ABN AMRO, FX Outlook 2026: More Dollar Weakness Ahead (2025). https://www.abnamro.com/research/en/our-research/fx-outlook-2026-more-dollar-weakness-ahead
- J.P. Morgan Private Bank Asia, 2026 Asia Outlook (December 2025). https://privatebank.jpmorgan.com/apac/en/insights/markets-and-investing/asf/2026-asia-outlook
- J.P. Morgan Private Bank Asia, 2026 Asia Outlook (December 2025). https://privatebank.jpmorgan.com/apac/en/insights/markets-and-investing/asf/2026-asia-outlook
- ING Think, Asia FX Talking: Relatively Broad-Based Pressure (March 2026). https://think.ing.com/articles/asia-fx-talking-march-2026/
- RBC Capital Markets, Currency Report Card: Oil Shock Rebalances Global Valuations (March 2026). https://www.rbccm.com/assets/rbccm/docs/fx/currency-report-card.pdf
- ING Think, Asia FX Outlook 2026: Opportunities in the Renminbi, Won, and Rupee (November 2025). https://think.ing.com/articles/asia-2026-fx-outlook/