How Much of Denver Can Walk
to Frequent Transit?
Frequency is what turns a bus line into something people can use without planning around it. When a bus comes every 15 minutes or better, you can walk to the stop and go. A missed trip costs a few minutes instead of an hour, and transferring between routes becomes practical. Service that runs less often forces riders to build their day around a timetable. That burden falls hardest on people without a car, whose trips don't all happen at rush hour.
This analysis measures where frequent service exists across the Regional Transportation District (RTD) network in metro Denver, how many people can walk to it, and how much of it disappears once the workday ends.
At a Glance: Rush Hour vs. After 7 PM
Results are for a typical weekday, Wednesday, September 30, 2026. A route or stop counts as frequent when its median scheduled gap is 15 minutes or less.
Frequent Service Is a Daytime Network
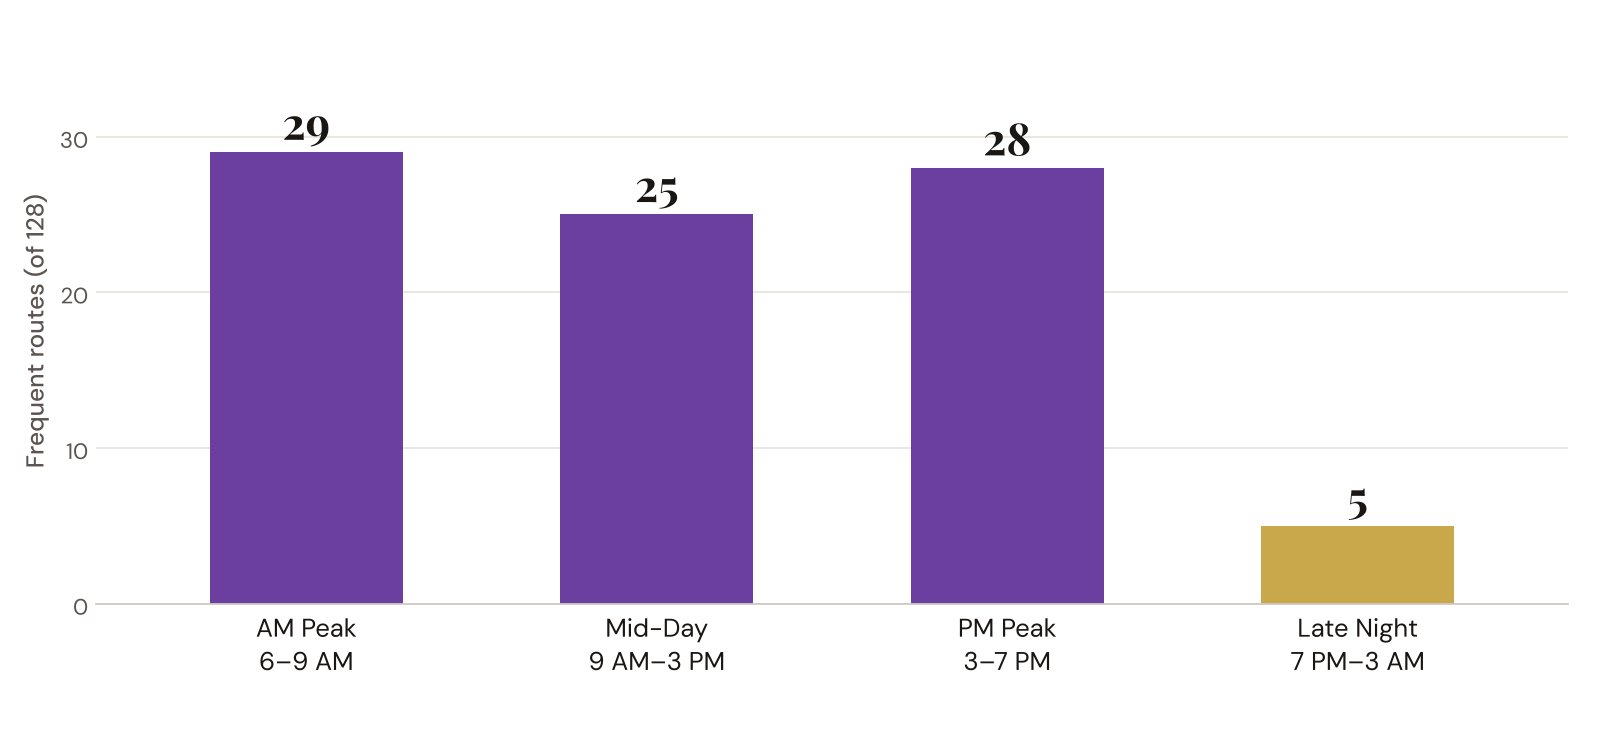
Through the day, RTD's frequent network holds steady: 29 routes run every 15 minutes or better in the morning peak, 25 at mid-day, and 28 in the evening rush. After 7 PM, that network nearly vanishes. Only five routes stay frequent, and no rail line is among them.
The five routes that stay frequent after 7 PM
Most of the System Runs Every 30 Minutes or Worse
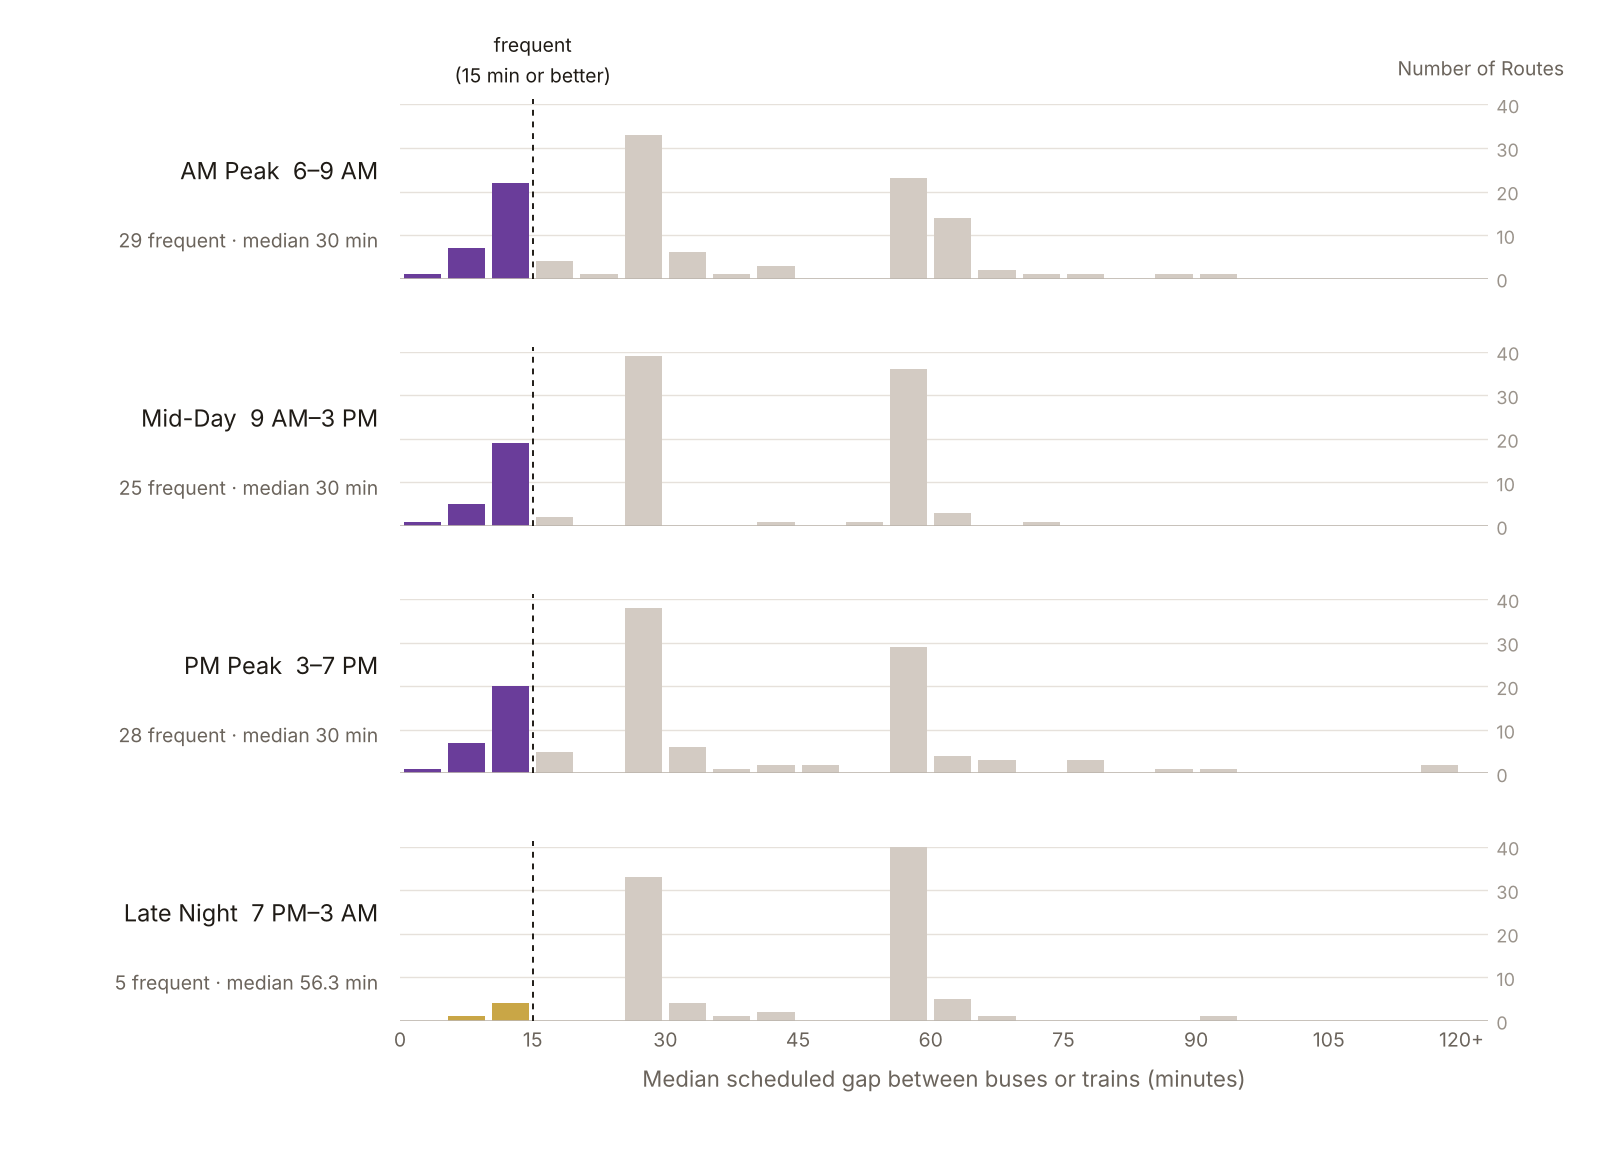
Frequent routes are the exception, not the rule. The typical RTD route comes every 30 minutes during the day, and roughly once an hour (56 minutes) late at night. The chart below shows every route's median gap in each period: the colored bars on the left are the frequent network, and most of the system sits in the tall gray stacks at 30 and 60 minutes.
Where Frequent Service Is, and When It Disappears
Daytime frequent service forms a real grid across central and east Denver, with branches along West Colfax, Federal, and South Broadway and a second cluster in Boulder. After 7 PM, the grid shrinks to a cross along Broadway and Colfax, plus the Federal corridor and the SKIP in Boulder. The share of stops with frequent service falls by about 80%, from 22.4% in the AM peak to 4.8% late at night.

Who Can Walk to Frequent Transit?
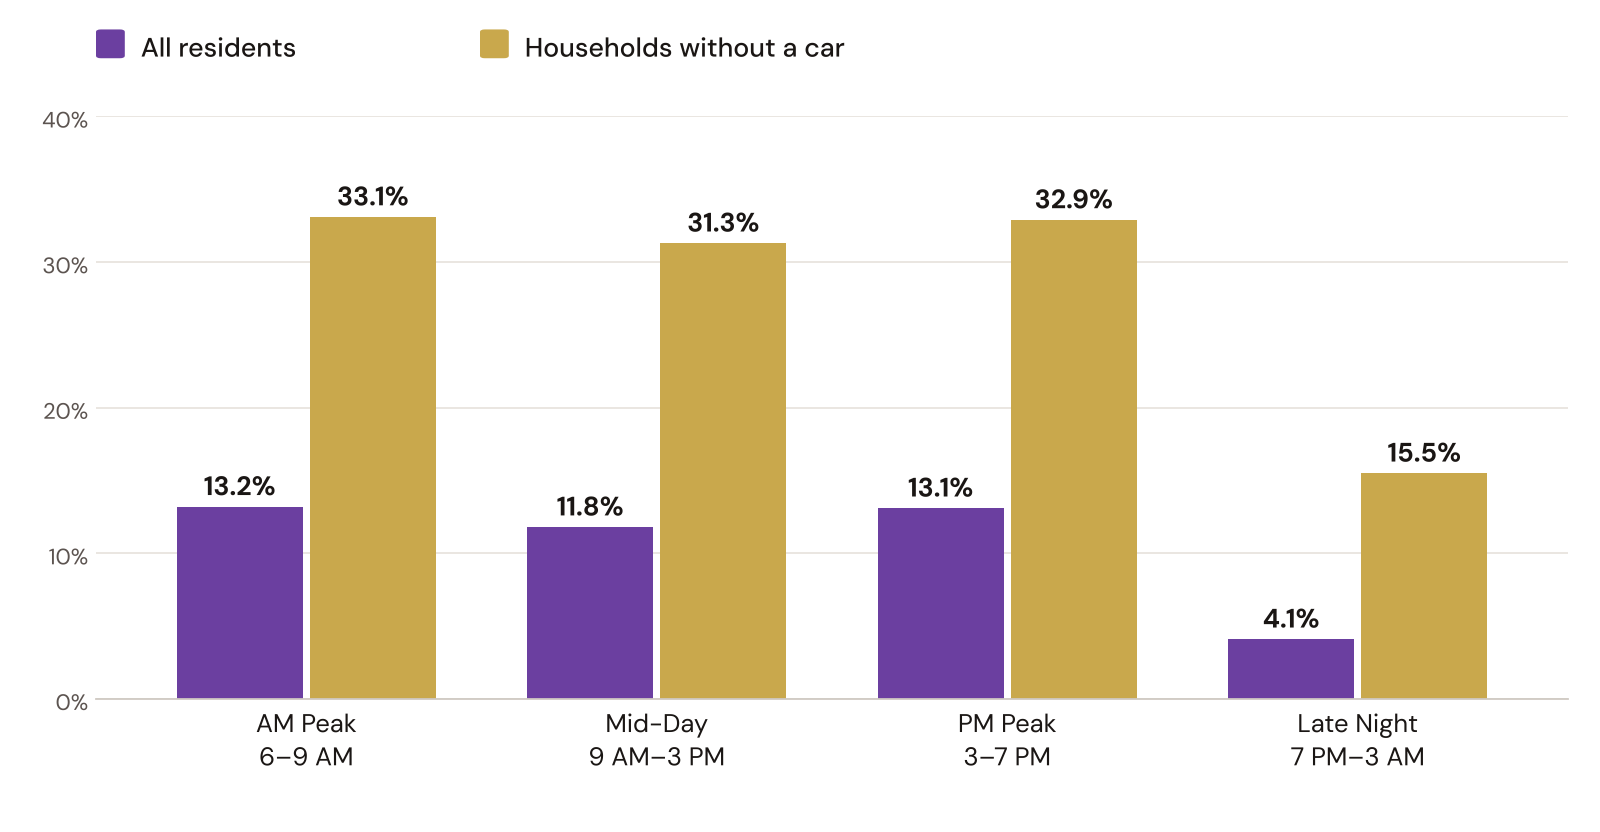
About 1 in 8 residents of the seven-county RTD area (13.2% of 3.2 million people) live within a quarter-mile walk of a frequent stop during the morning rush. Late at night, that falls to 4.1%.
Households without a car are better served: a third of them (33.1%) live near frequent AM service, more than twice the rate for all households (14.8%). That reflects where car-free households tend to live: the denser, older neighborhoods the frequent grid runs through. But they also lose the most after dark. Late at night, only 15.5% remain within a short walk of frequent service.
| Period | Frequent routes | Frequent stops | Residents within ¼-mile walk | Car-free households within ¼-mile walk |
|---|---|---|---|---|
| AM Peak (6–9 AM) | 29 | 22.4% | 13.2% | 33.1% |
| Mid-Day (9 AM–3 PM) | 25 | 19.5% | 11.8% | 31.3% |
| PM Peak (3–7 PM) | 28 | 23.1% | 13.1% | 32.9% |
| Late Night (7 PM–3 AM) | 5 | 4.8% | 4.1% | 15.5% |
A worker on a 9-to-5 schedule only needs the peaks. Someone who heads to a restaurant or hospital shift in the afternoon and comes home at midnight needs frequent service in both directions of that trip, so their access is capped by the late-night row.
Why Measure Along Real Streets?
Most accessibility studies draw a quarter-mile circle around each stop. That's easy, but it assumes people can walk in a straight line through freeways, rail yards, and cul-de-sacs. This analysis builds a routable walking network from OpenStreetMap streets, sidewalks, and paths, and finds everywhere within a quarter-mile walk of a frequent stop.
The Frequent Routes
Every route that is frequent in at least one period, with its median scheduled headway in minutes (in its less frequent direction). Highlighted cells mark periods where the route qualifies as frequent; a dash means no service or a single trip.
| Route | Name | Mode | AM Peak | Mid-Day | PM Peak | Late Night |
|---|---|---|---|---|---|---|
| FreeRide | 16th Street FreeRide | Bus | 3 | 3 | 3 | 6.8 |
| 15 | East Colfax Avenue | Bus | 10 | 10 | 10 | 15 |
| 31 | Federal Blvd | Bus | 10 | 10 | 10 | 15 |
| SKIP | Broadway (Boulder) | Bus | 10 | 10 | 10 | 15 |
| 0 | Broadway | Bus | 15 | 15 | 15 | 15 |
| 43 | Martin Luther King Blvd | Bus | 7.5 | 15 | 8 | 30 |
| 15L | East Colfax Limited | Bus | 10 | 10 | 10 | 30 |
| 16 | West Colfax Avenue | Bus | 15 | 10 | 10 | 30 |
| 0L | South Broadway Limited | Bus | 15 | 15 | 15 | – |
| C | Union Station to Mineral Station | Light rail | 15 | 15 | 15 | 30 |
| E | Union Station to RidgeGate Parkway Station | Light rail | 15 | 15 | 15 | 30 |
| T | Lincoln Station to Alameda Station | Light rail | 15 | 15 | 15 | 30 |
| W | Union Station to Jefferson County Government Center-Golden Station | Light rail | 15 | 15 | 15 | 30 |
| 105 | Havana Street | Bus | 15 | 15 | 15 | 30 |
| R | RidgeGate Parkway Station to Peoria Station | Light rail | 15 | 15 | 15 | 30 |
| G | Union Station to Wheat Ridge Ward Station | Commuter rail | 15 | 15 | 15 | 30 |
| 153 | Chambers Road | Bus | 15 | 15 | 15 | 30 |
| 17 | Golden/Colfax | Bus | 15 | 15 | 15 | 30 |
| 21 | East Evans Avenue | Bus | 15 | 15 | 15 | 30 |
| 30 | South Federal Blvd | Bus | 15 | 15 | 15 | 30 |
| 40 | Colorado Boulevard | Bus | 15 | 15 | 15 | 30 |
| 73 | Quebec Street | Bus | 15 | 15 | 15 | 30 |
| Bound | 30th Street | Bus | 15 | 15 | 15 | 30 |
| FF1 | Flatiron Flyer | Bus | 15 | 15 | 15 | 30 |
| JUMP | Boulder / Lafayette/ Erie | Bus | 15 | 15 | 15 | 30 |
| MetroRide | Free MetroRide | Bus | 10 | – | 10 | – |
| 121 | Peoria Street | Bus | 15 | 15.6 | 15 | 30 |
| 12 | South Downing | Bus | 15 | 30 | 15.5 | 30 |
| 120X | Wagon Road / Thornton Express | Bus | 15 | 30 | 17 | 40 |
| 204 | Table Mesa / Moorhead / North 19th | Bus | 16 | 30 | 15 | 30 |
Medians use only gaps between two trips that both leave inside the period. A route that mixes 15- and 30-minute service within a period can still have a 15-minute median.
How the Analysis Works
- Load the schedule. RTD's public GTFS feed (downloaded October 6, 2026) goes into DuckDB, a SQL database that runs inside R.
- Pick a typical weekday. The SQL expands the service calendar into individual dates, applies holiday exceptions, and chooses the Wednesday with the most scheduled trips.
- Split the day into four periods: AM Peak (6–9 AM), Mid-Day (9 AM–3 PM), PM Peak (3–7 PM), and Late Night (7 PM–3 AM).
- Measure headways. A
LAG()window function finds the time between successive trips for every route and direction, counting only gaps between two trips that both leave inside the same period. A route is frequent if its median gap is 15 minutes or less in every direction, with at least four trips each way. - Flag frequent stops. A stop is frequent if a single route serving it has a median gap of 15 minutes or less there. Stacking several infrequent routes doesn't count, because riders can't combine them into one wait.
- Build walksheds on the street network. OpenStreetMap becomes a routable walking graph, and one shortest-path search per period finds everywhere within a quarter-mile walk.
- Count who lives nearby. Census ACS block groups are weighted by how much of their area falls inside each walkshed.
Limitations
- Results describe scheduled service on one Wednesday. They don't cover weekends or real-world on-time performance.
- The median describes the typical gap, not the worst one. A route that runs every 15 minutes for most of a period and every 30 for the rest still counts as frequent.
- OpenStreetMap often draws a street with sidewalks as one centerline, so the walk network assumes both sides are walkable and ignores how hard it is to cross a wide arterial.
- Areal weighting assumes people are spread evenly across each block group.
Final Thoughts
RTD runs a genuinely useful frequent network during the day. For the roughly 430,000 people who live near it at rush hour, transit can work the way it should: walk up and go. But the network is built around a commute that a growing share of riders doesn't make. Service workers, hospital staff, students, and anyone heading home after dinner find a system where the typical route comes once an hour and only five corridors remain frequent.
The people most dependent on transit feel that drop the hardest. Car-free households start the day with twice the access of everyone else and end it with half of what they had. If the goal is a network people can build a life around rather than just a commute, the evening hours are where the gap is widest.
Data & Sources
- Regional Transportation District, GTFS schedule feed, downloaded October 6, 2026. Service day analyzed: Wednesday, September 30, 2026. https://www.rtd-denver.com/open-records/open-spatial-information/gtfs
- U.S. Census Bureau, American Community Survey 5-year estimates, 2019–2023, tables B01003 (total population) and B25044 (vehicles available), by block group for Adams, Arapahoe, Boulder, Broomfield, Denver, Douglas, and Jefferson counties. https://www.census.gov/programs-surveys/acs
- OpenStreetMap contributors, Colorado extract via Geofabrik. Data © OpenStreetMap contributors, ODbL. https://www.openstreetmap.org/copyright
- Full code (SQL, R, Quarto), output tables, and an interactive map with per-stop headways: https://github.com/austinthomas7/rtd-frequent-network