Data-driven reports that translate complex information into clear, honest insights — helping you understand where you actually stand, so you can decide where to go next.
13
Charts & graphics
26
Years of FX data
13
Currencies tracked
2
Reports published
Global Economics
How Have Currency Exchange Rates Changed Since the Birth of the Euro?
📅 March 2026⏱ 15 min read
A 26-year analysis of how the dollar has fared against 13 currencies across Europe, Latin America, and Asia — and what lies ahead for American travelers in 2026 and beyond.
Key Findings
Swiss Franc is the only European currency with persistent, structural appreciation vs. the dollar
The Yen hit multi-decade lows in the early 2020s as the BoJ held rates near zero
Brazil's Real is the most volatile currency in the dataset
The era of an exceptionally strong US dollar appears to be fading
Read Report
Personal Finance
2025 Financial Report — Quarters 1 & 2
📅 Sept 2025⏱ 12 min read
A rigorous personal cash flow analysis covering six months of spending data — from monthly inflows and outflows to weekly net trends and a breakdown of essential vs. discretionary costs.
By Austin Foster · Sept 2025 (last modified on March 15, 2026) · Personal cash flow analysis covering January–June 2025
This report summarizes six months of personal banking data, organized to provide clarity on earning patterns, spending habits, and overall cash flow trajectory. The goal isn't just to present numbers — it's to ask the honest questions those numbers raise, and to use data as a tool for behavioral change.
Cash Flow Analysis
Monthly Inbound & Outbound Cash Flows
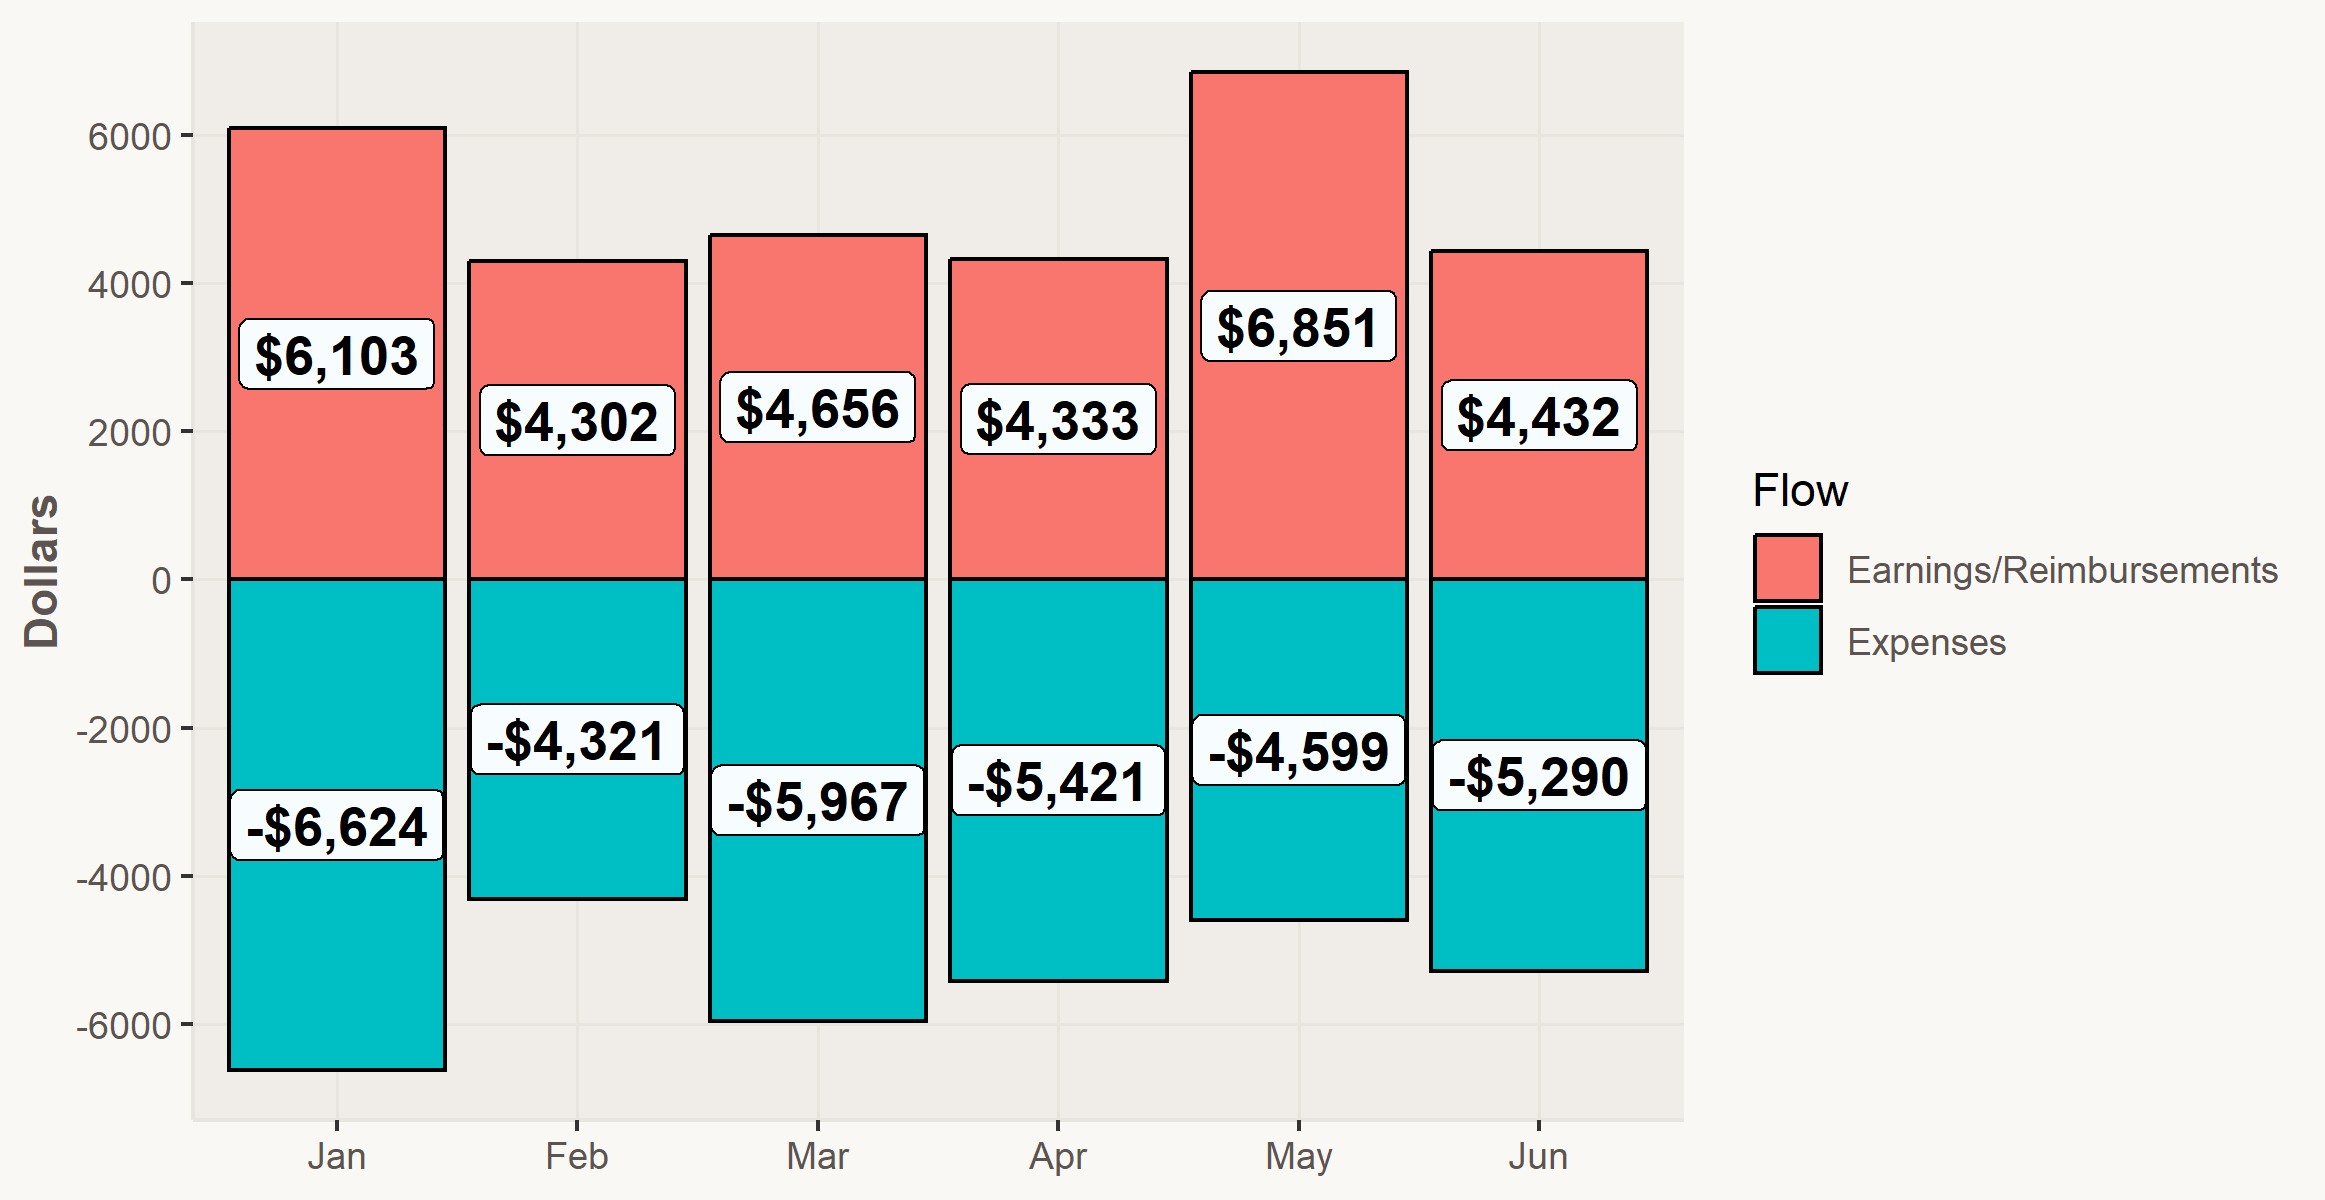
The following table summarizes total monthly earnings (credits) versus total monthly expenses (debits) across all six months.
Monthly Cash Flow Chart
Month
Earnings
Expenses
Net
January
$6,103
-$6,624
-$521
February
$4,302
-$4,321
-$19
March
$4,656
-$5,967
-$1,311
April
$4,333
-$5,421
-$1,088
May
$6,851
-$4,599
+$2,252
June
$4,432
-$5,290
-$858
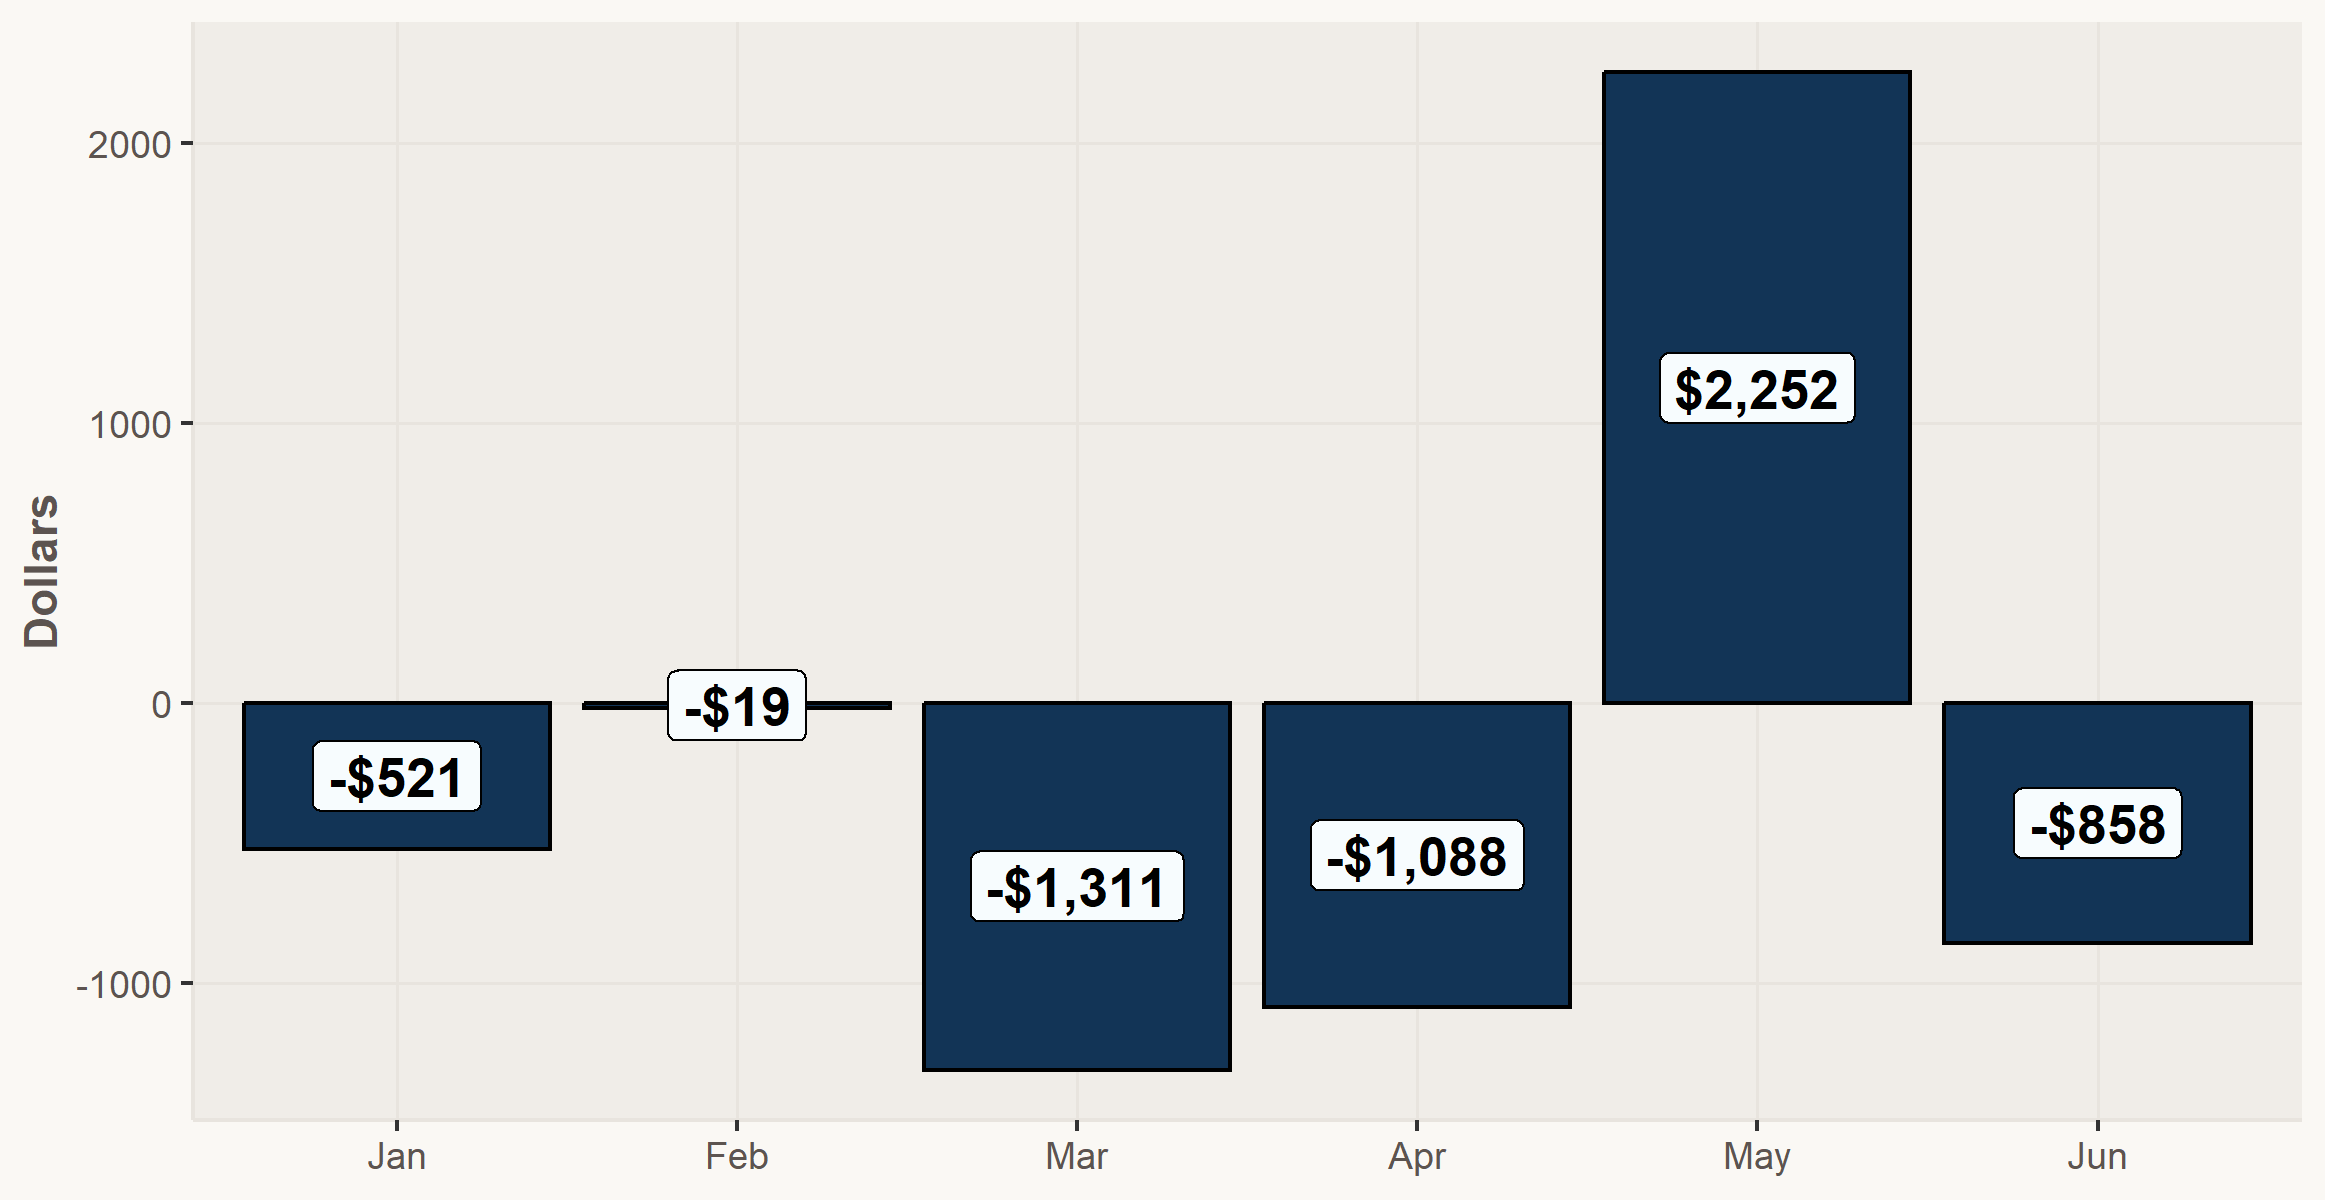
Net Monthly Cash Flow
Exercise 1 — Identifying My Monthly Earning and Spending Behavior
When reviewing monthly cash flows, I think three things are important. When did I earn the most, when did I spend the most, and what are the impacts on my net cash flow. January and May stand out as the highest earning months, while January and March saw the heaviest spending. May is the only month with a positive net cash flow.
Monthly Cash Flow Summary
May
Highest Income Month ($6,851)
January
Highest Spending Month (-$6,624)
May
Best Cash Flow Month (+$2,252)
$5,113
Average Monthly Earnings
-$5,371
Average Monthly Spending
-$258
Average Net Monthly Cash Flow
Weekly Net Cash Flow Summary
-$2,761
Worst week (minimum)
-$59.54
Average net weekly flow
+$1,812
Best week (maximum)
The most important metric here is the average net weekly cash flow of -$59.54. When this figure is below zero, it means you are losing money on average each week. Over the course of these first two financial quarters, the total net loss was $1,548.
Spending Analysis
Essential Spending
Essential expenses include rent, food, medical costs, and other non-negotiable living costs. The general guideline is to keep these below 60% of monthly income.
Month
Earnings
Essential Expenses
% of Income
January
$6,103
$2,452
40.2%
February
$4,302
$2,441
56.7%
March
$4,656
$2,842
61.0%
April
$4,333
$2,145
49.5%
May
$6,851
$2,581
37.7%
June
$4,432
$2,646
59.7%
Exercise 2 — Are basic life costs drowning me?
Two months (March and June) either met or exceeded the 60% threshold. The average hovers around 51% — just under the danger zone. On months with lower earnings, essential costs become a proportionally heavier burden. I should consider whether fixed costs like rent or subscriptions can be renegotiated or reduced.
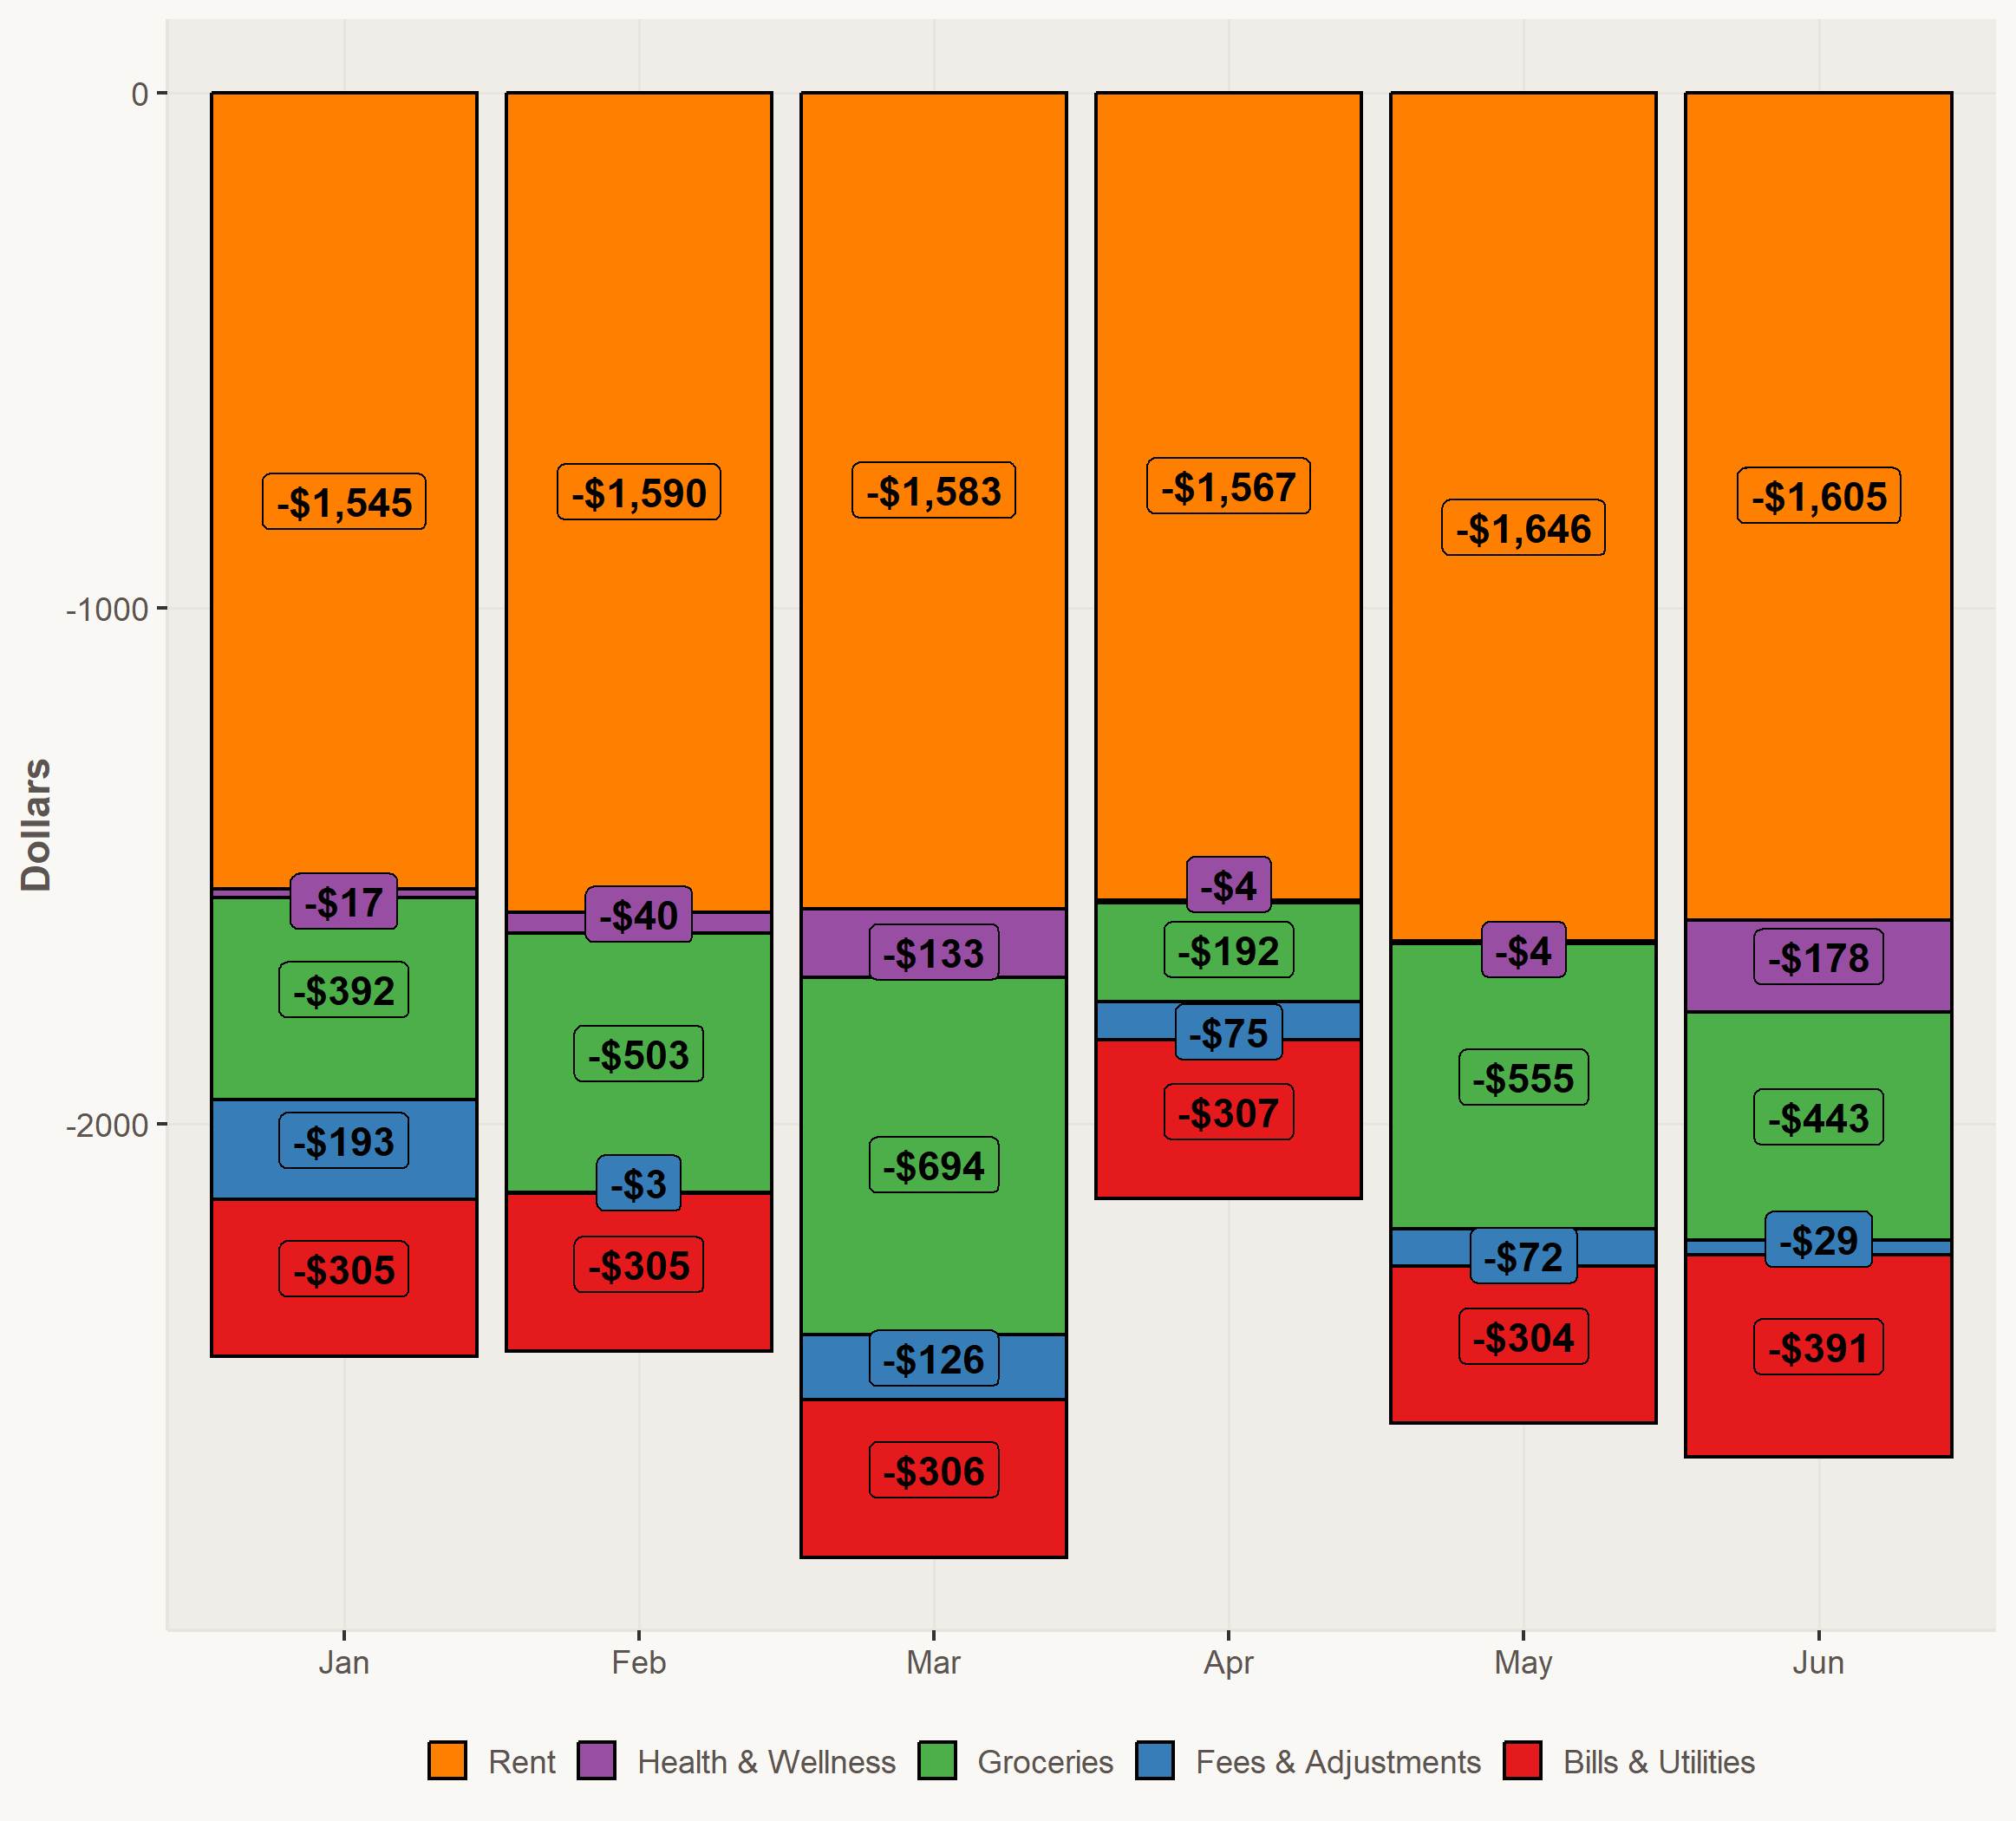
Essential Spending — Dollar Amounts
Exercise 3 — What are the largest contributors to my essential spending totals? Can any improvements be made?
Unsurprisingly, my monthly rent payment was the largest contributor to my essential spending in the first half of 2025. However, when referencing my monthly totals against my average monthly earnings, I see little need for improvement. The percentages I spend are in line with what financial analysts recommend. I spent roughly 30% on housing, 5-10% on Bills and Debt Payments, and 10% on Groceries.
Discretionary Spending
Discretionary expenses — dining, travel, entertainment, shopping — should ideally account for no more than 20% of monthly income, with another 20% going to savings.
Month
Earnings
Discretionary Expenses
% of Income
January
$6,103
$4,171
68.3%
February
$4,302
$1,881
43.7%
March
$4,656
$2,839
61.0%
April
$4,333
$3,277
75.6%
May
$6,851
$2,019
29.5%
June
$4,432
$2,505
56.5%
Exercise 4 — Am I spending frivolously?
To be blunt, yes. There is not a single month where I fall underneath the guideline of 20 percent.
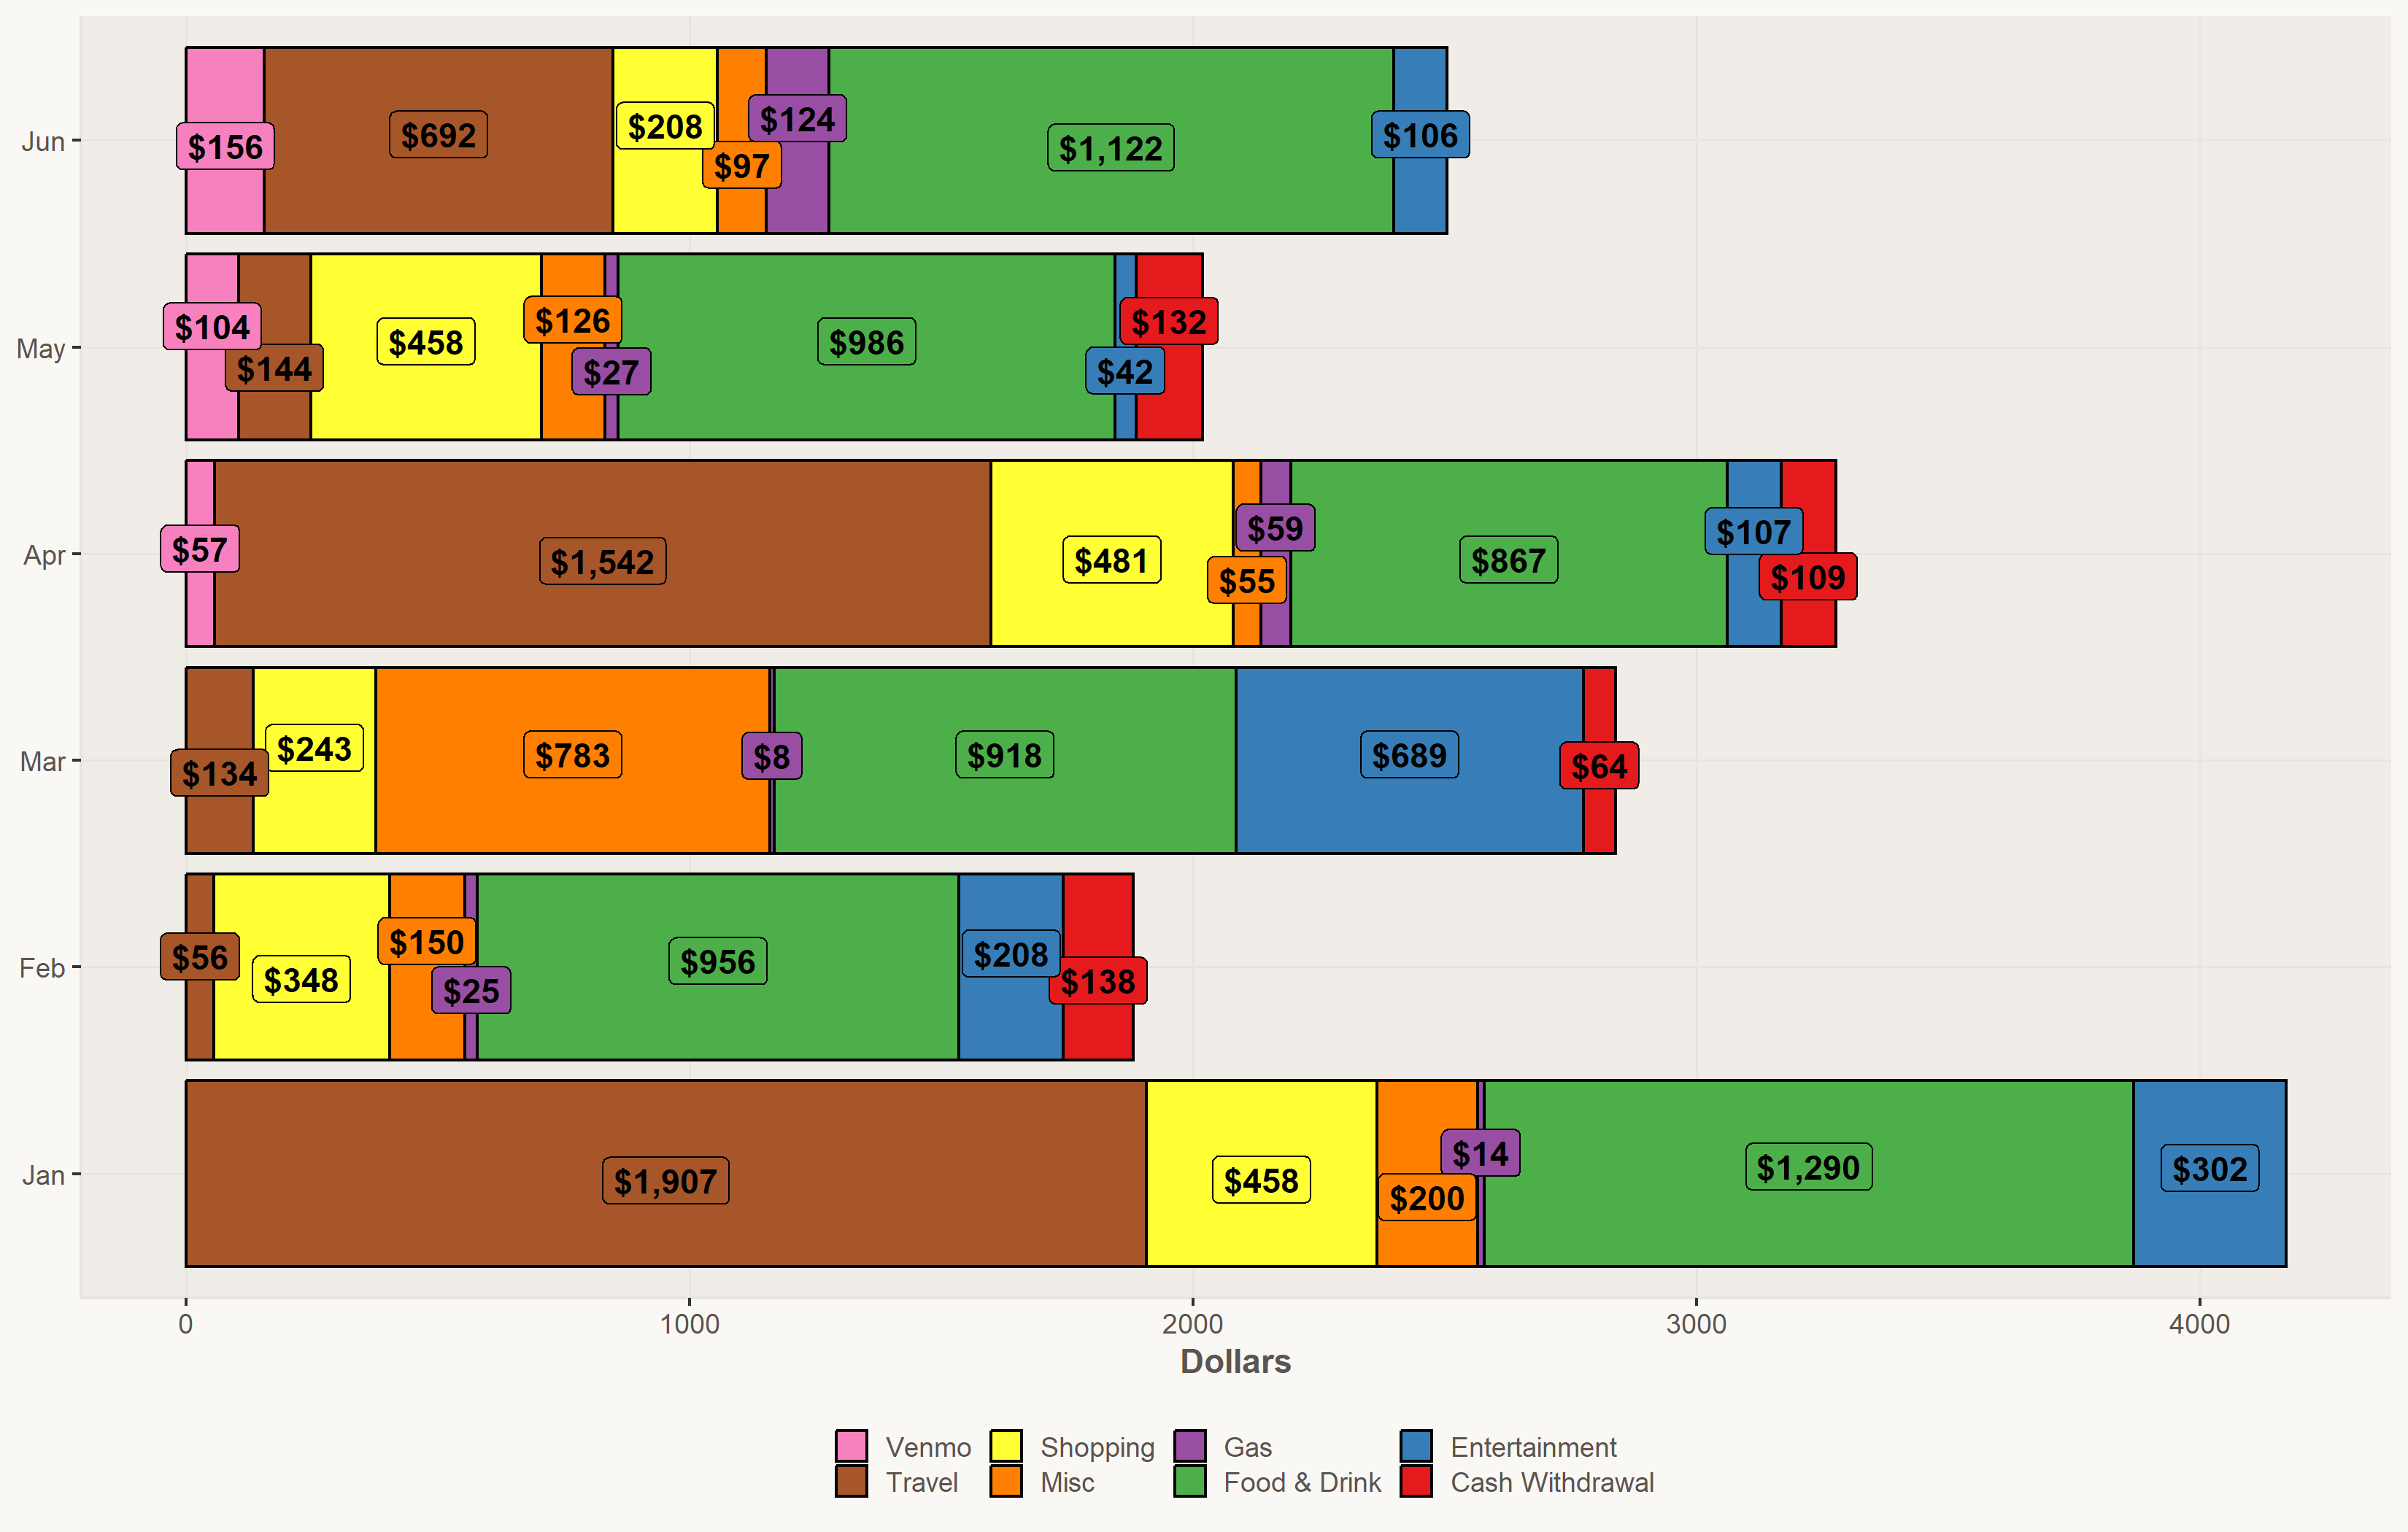
Discretionary Spending — Dollar Amounts
Exercise 5 — How am I spending frivolously?
I like to see the world, and that is accurately depicted in my spending. Flights, lodging, and taxis add up, and apparently culminated in quite a bit of cost for my roughly 3 and a half week trip to Colombia. I also love to go out for Food & Drinks, spending on average over $1,000 a month.
Exercise 6 — If I want to become cash flow positive, what is it about my behavior that I should change?
As stated previously, my net cash flow loss was roughly -$1,500. This means that I need to either make an additional $250 in gross income per month or cut roughly $250 in spending per month to break even. I already work more than I'd like, so the easiest solution would be to cut spending by $250/month. The lowest hanging fruit is glaring. Take a pause on international travel in the second half of 2025, and go out for drinks and meals less.
Final Thoughts
I was care free and not tracking my expenses for the first half of 2025. So being cognizant of that, ending the first two quarters with a loss of only $1,500 isn't too horrible. I was paying for my expenses back home, while traveling for almost a month, so it makes sense that I dug into my cash reserves. That being said, I know what needs to be done to perform better financially in the second quarter. As long as I take a break on travel, and do my best to make meals at home more often, there is no reason why I can't become cash flow positive in the second half of the year. Check back in for my next semi-annual review to see if I followed through on that promise.
Global Economics
How Have Currency Exchange Rates Changed Since the Birth of the Euro?
By Austin Foster · March 24, 2026 · Implications for American Travelers, 1999–2026
International travel is one of the most common aspirations of American workers. Whether it's a week in Tokyo, a long weekend in Mexico City, or a summer backpacking through Europe, the experience of traveling abroad is both culturally enriching and, for many, a significant financial undertaking. One of the most underappreciated variables in the cost of international travel is the exchange rate: the price at which your dollar converts into the local currency of wherever you're headed. A favorable exchange rate can make a trip feel like a bargain; an unfavorable one can silently drain your travel budget before you've ordered your first meal.
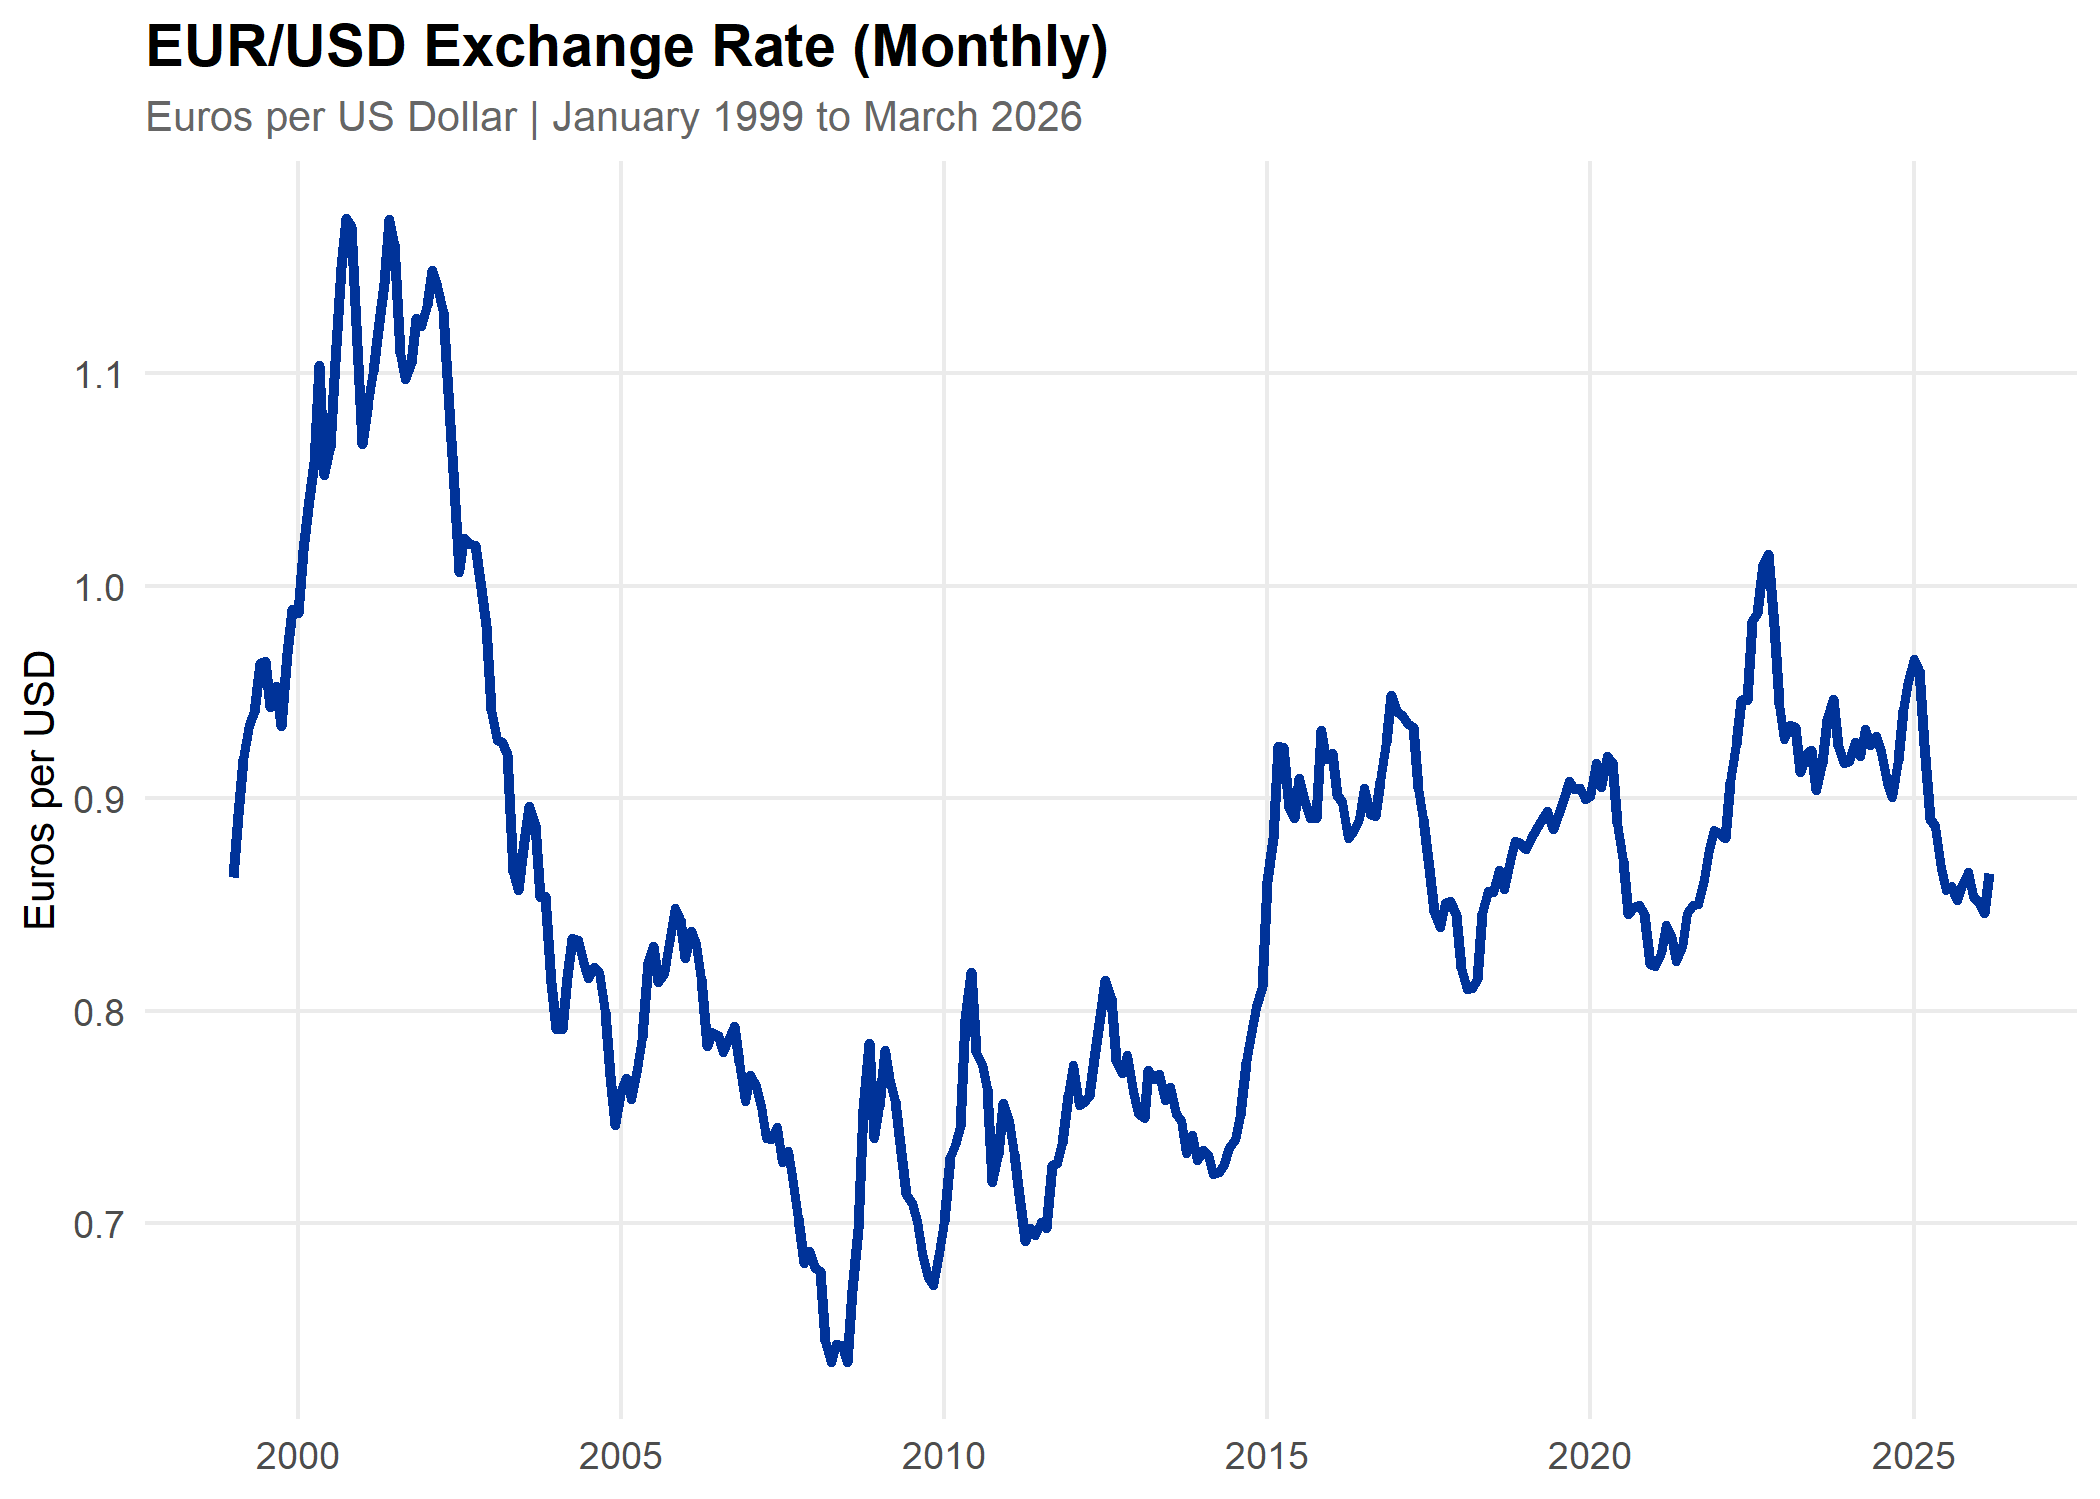
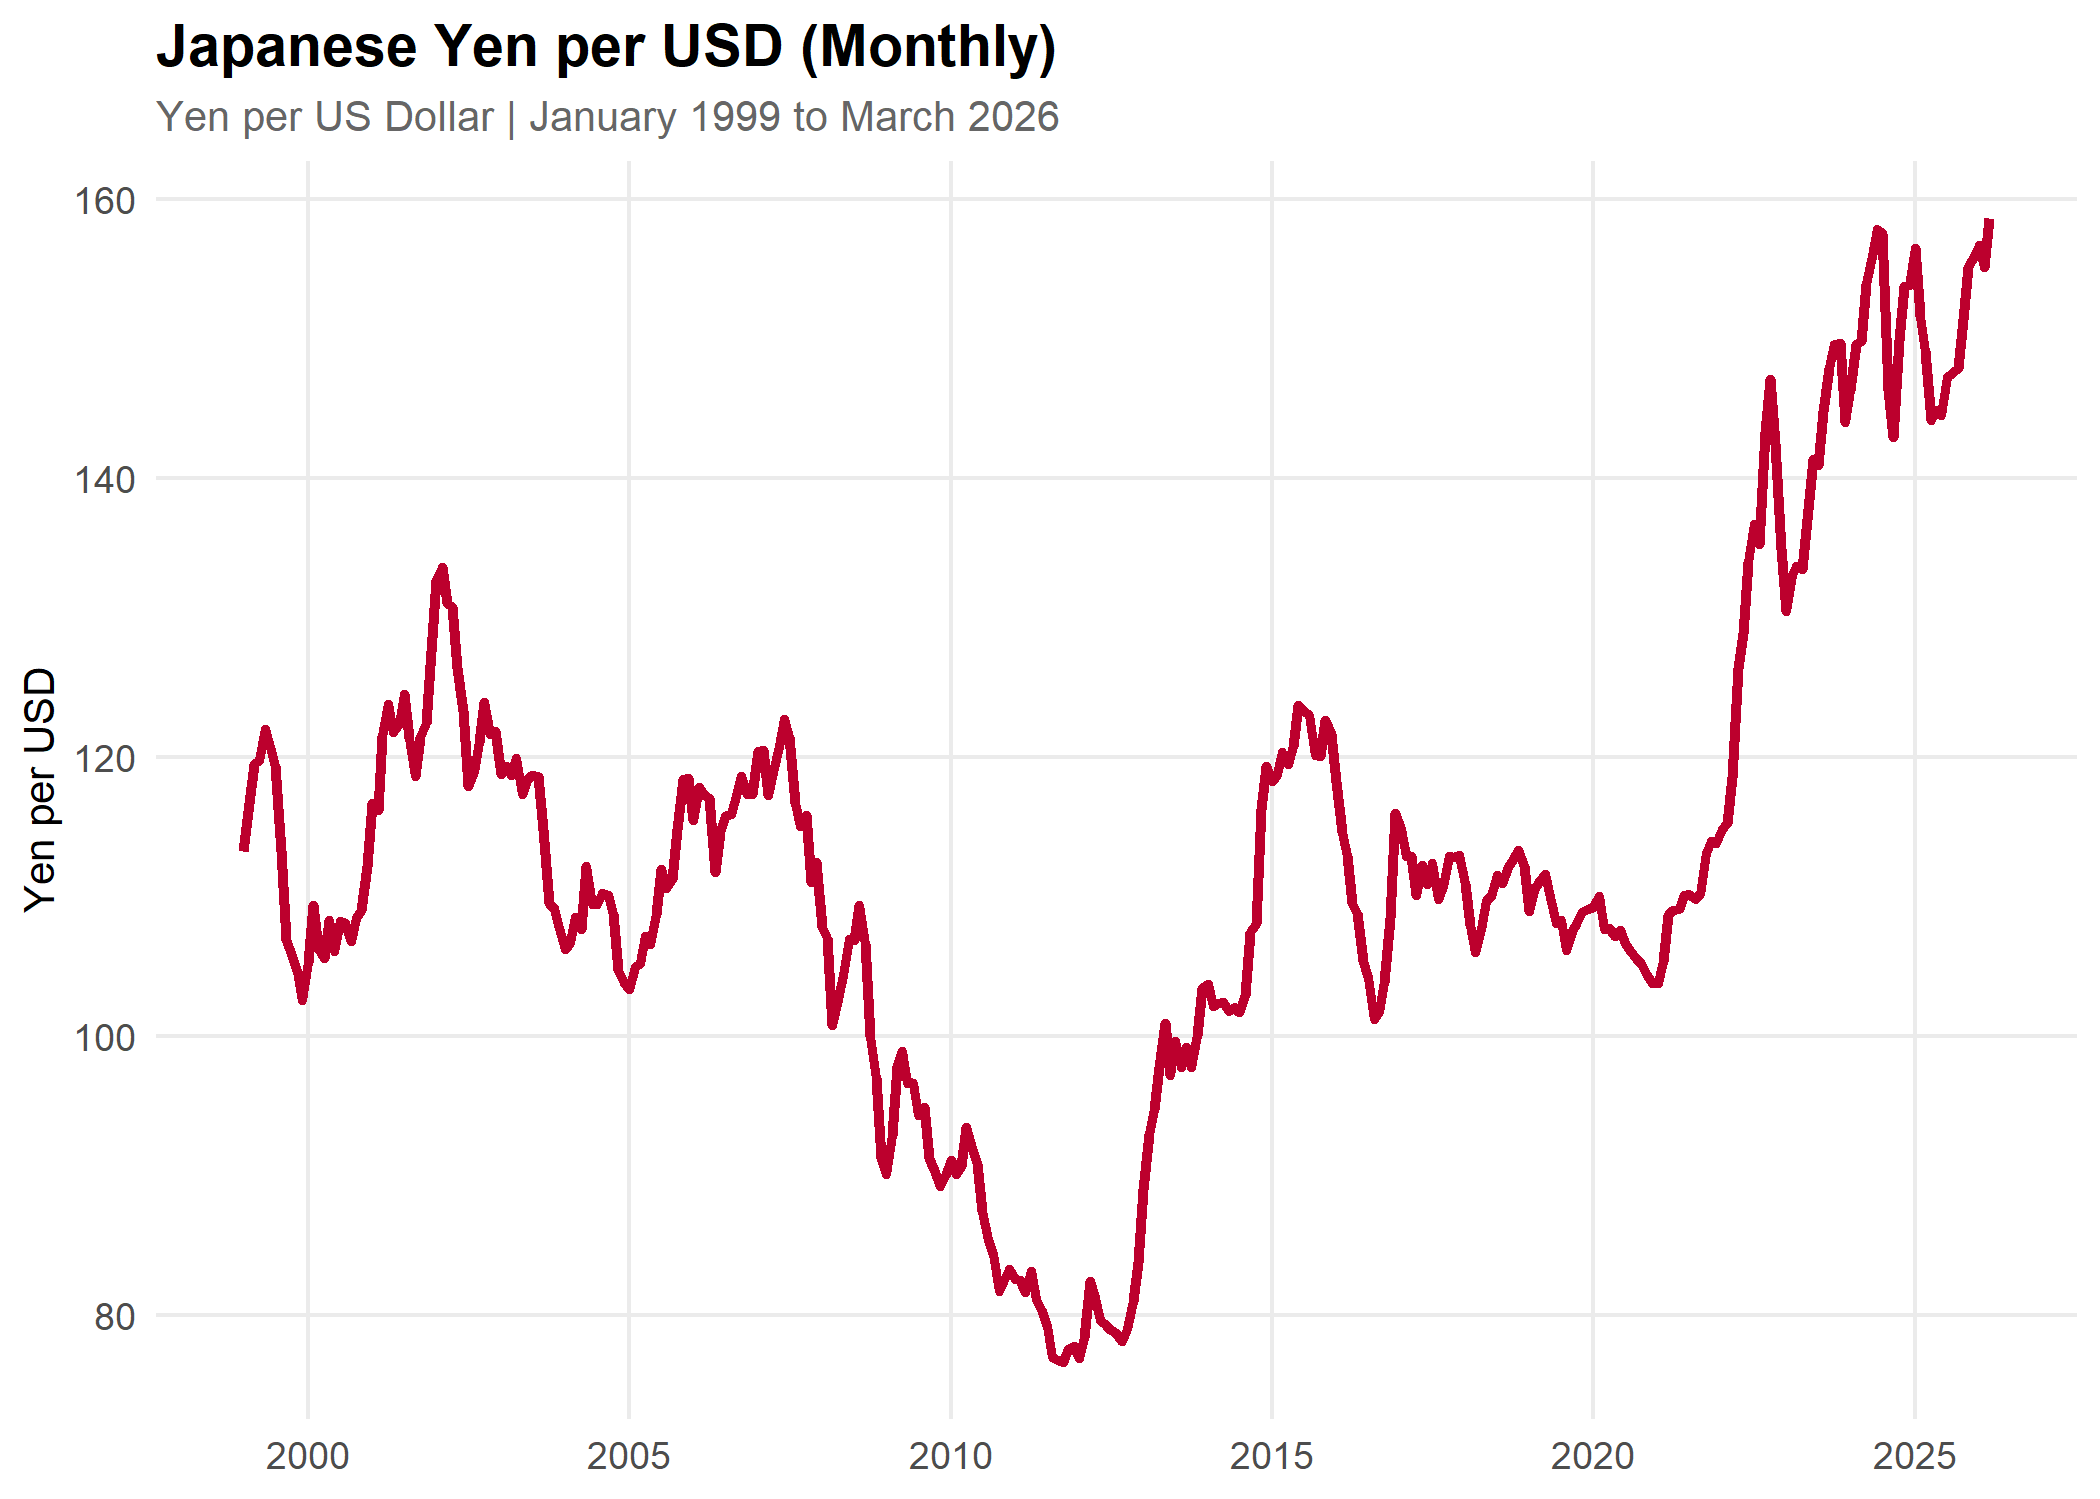
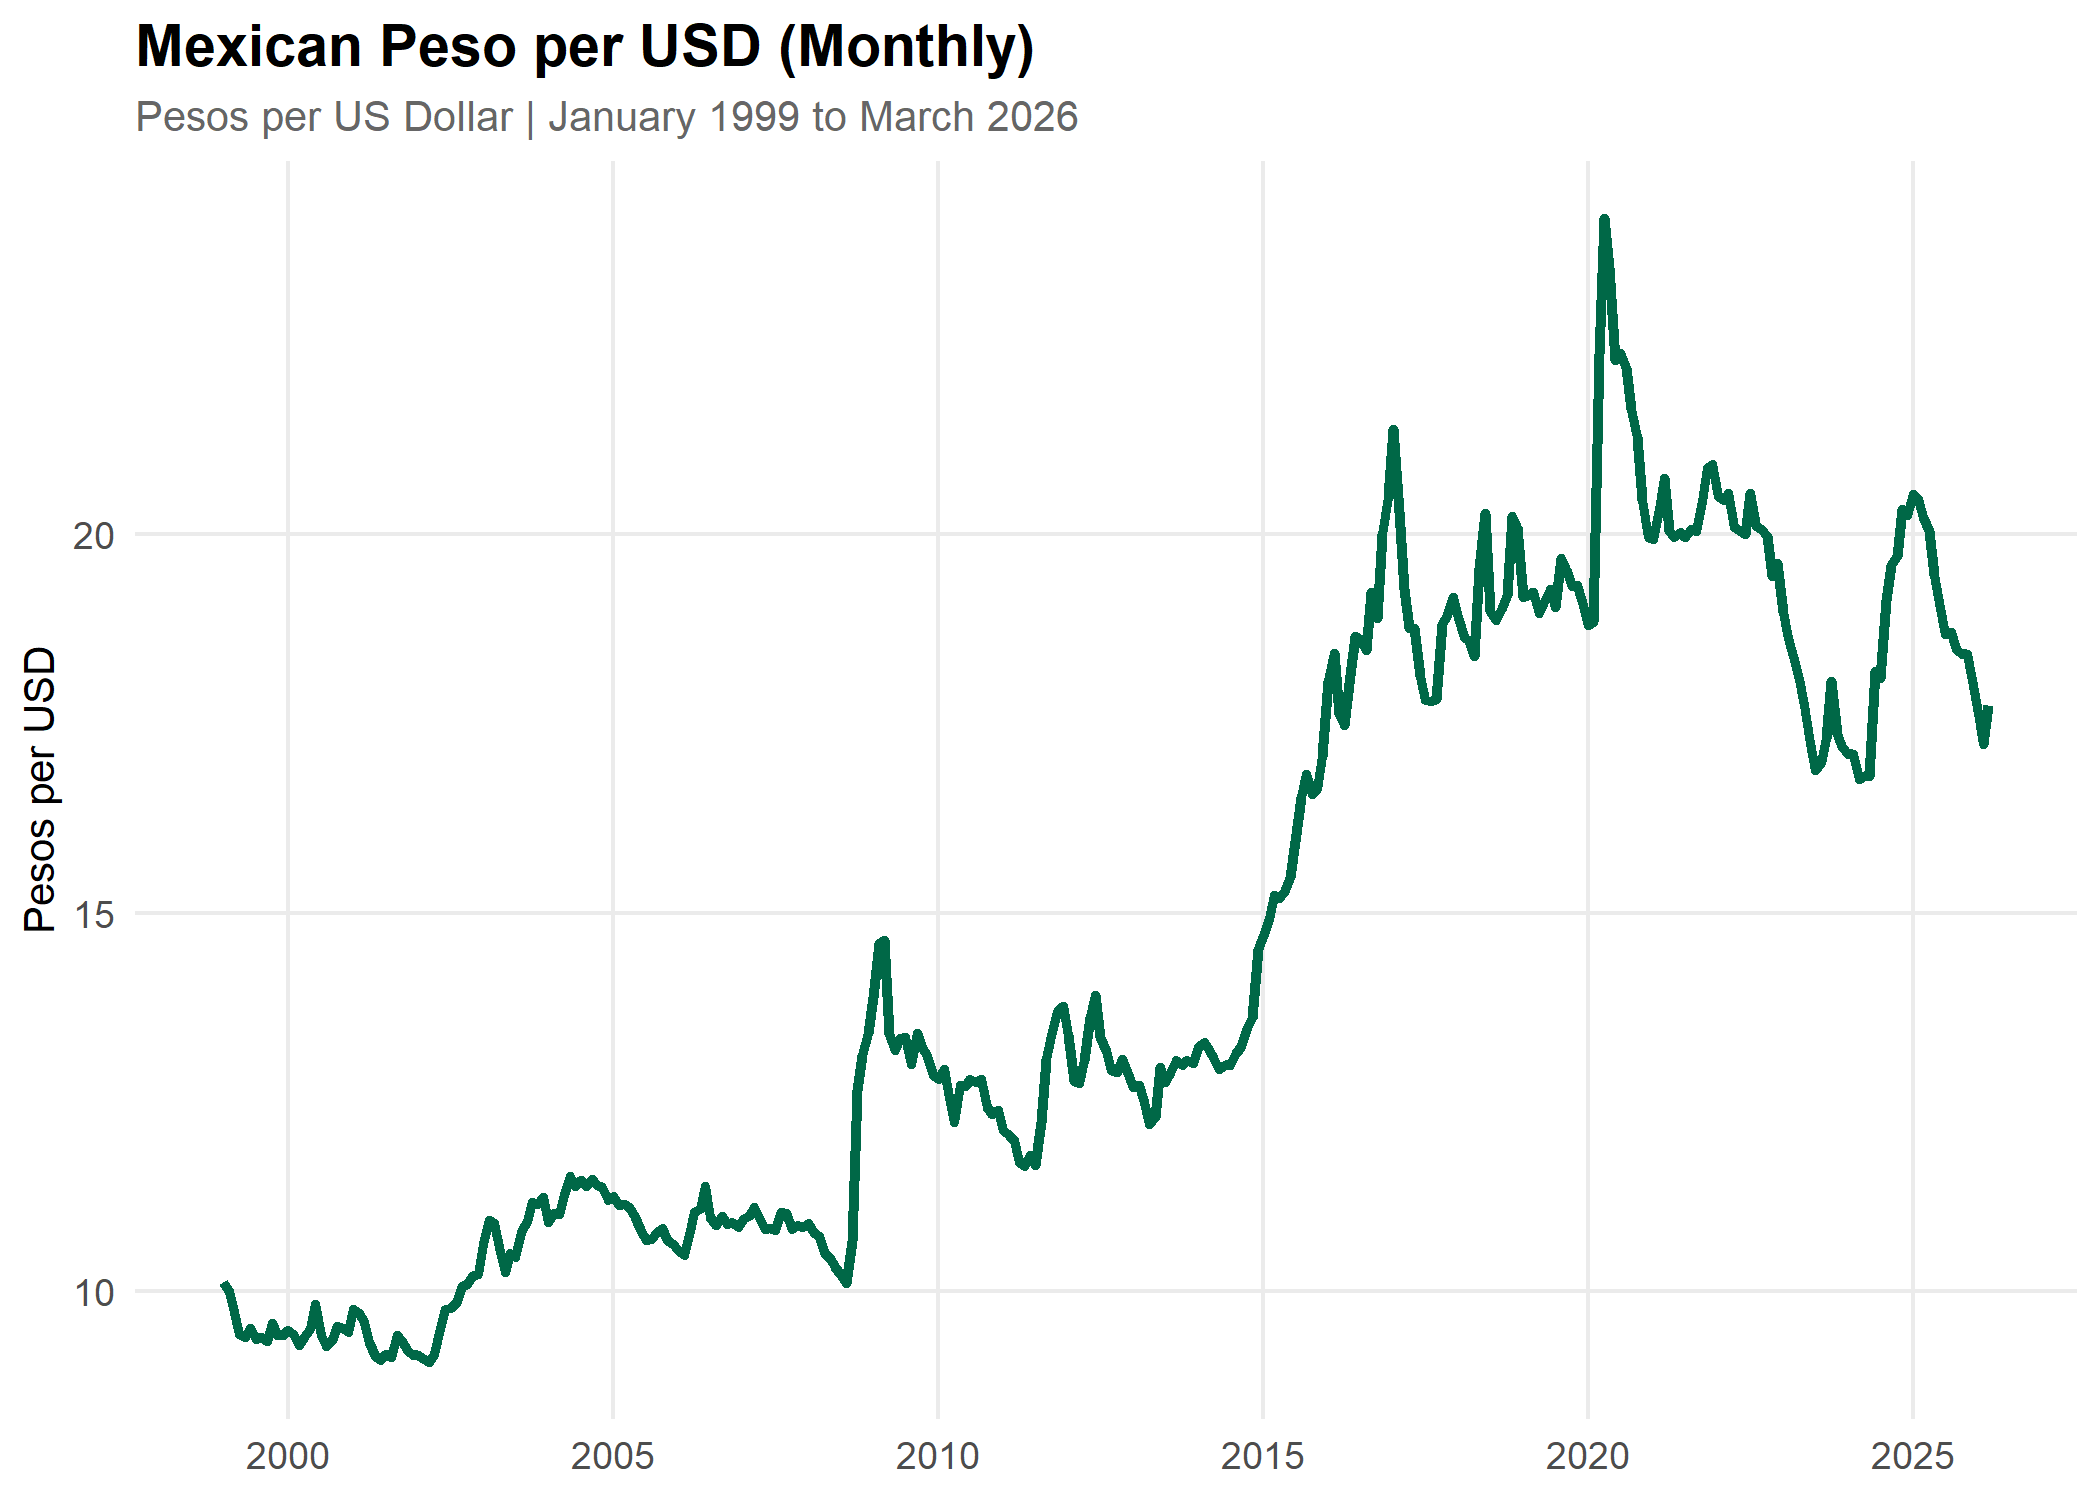
This analysis examines how currency exchange rates have shifted since the birth of the Euro in January 1999 — a moment that reshaped the global currency landscape and provides a natural starting point for a multi-decade comparison. The three currencies that Americans encounter most frequently in international travel are the Euro, the Mexican Peso, and the Japanese Yen, and their individual trajectories since 1999 already tell a rich story. The analysis then expands to a wider set of countries across Europe, Latin America, and Asia.
Exchange Rate Plot Examples
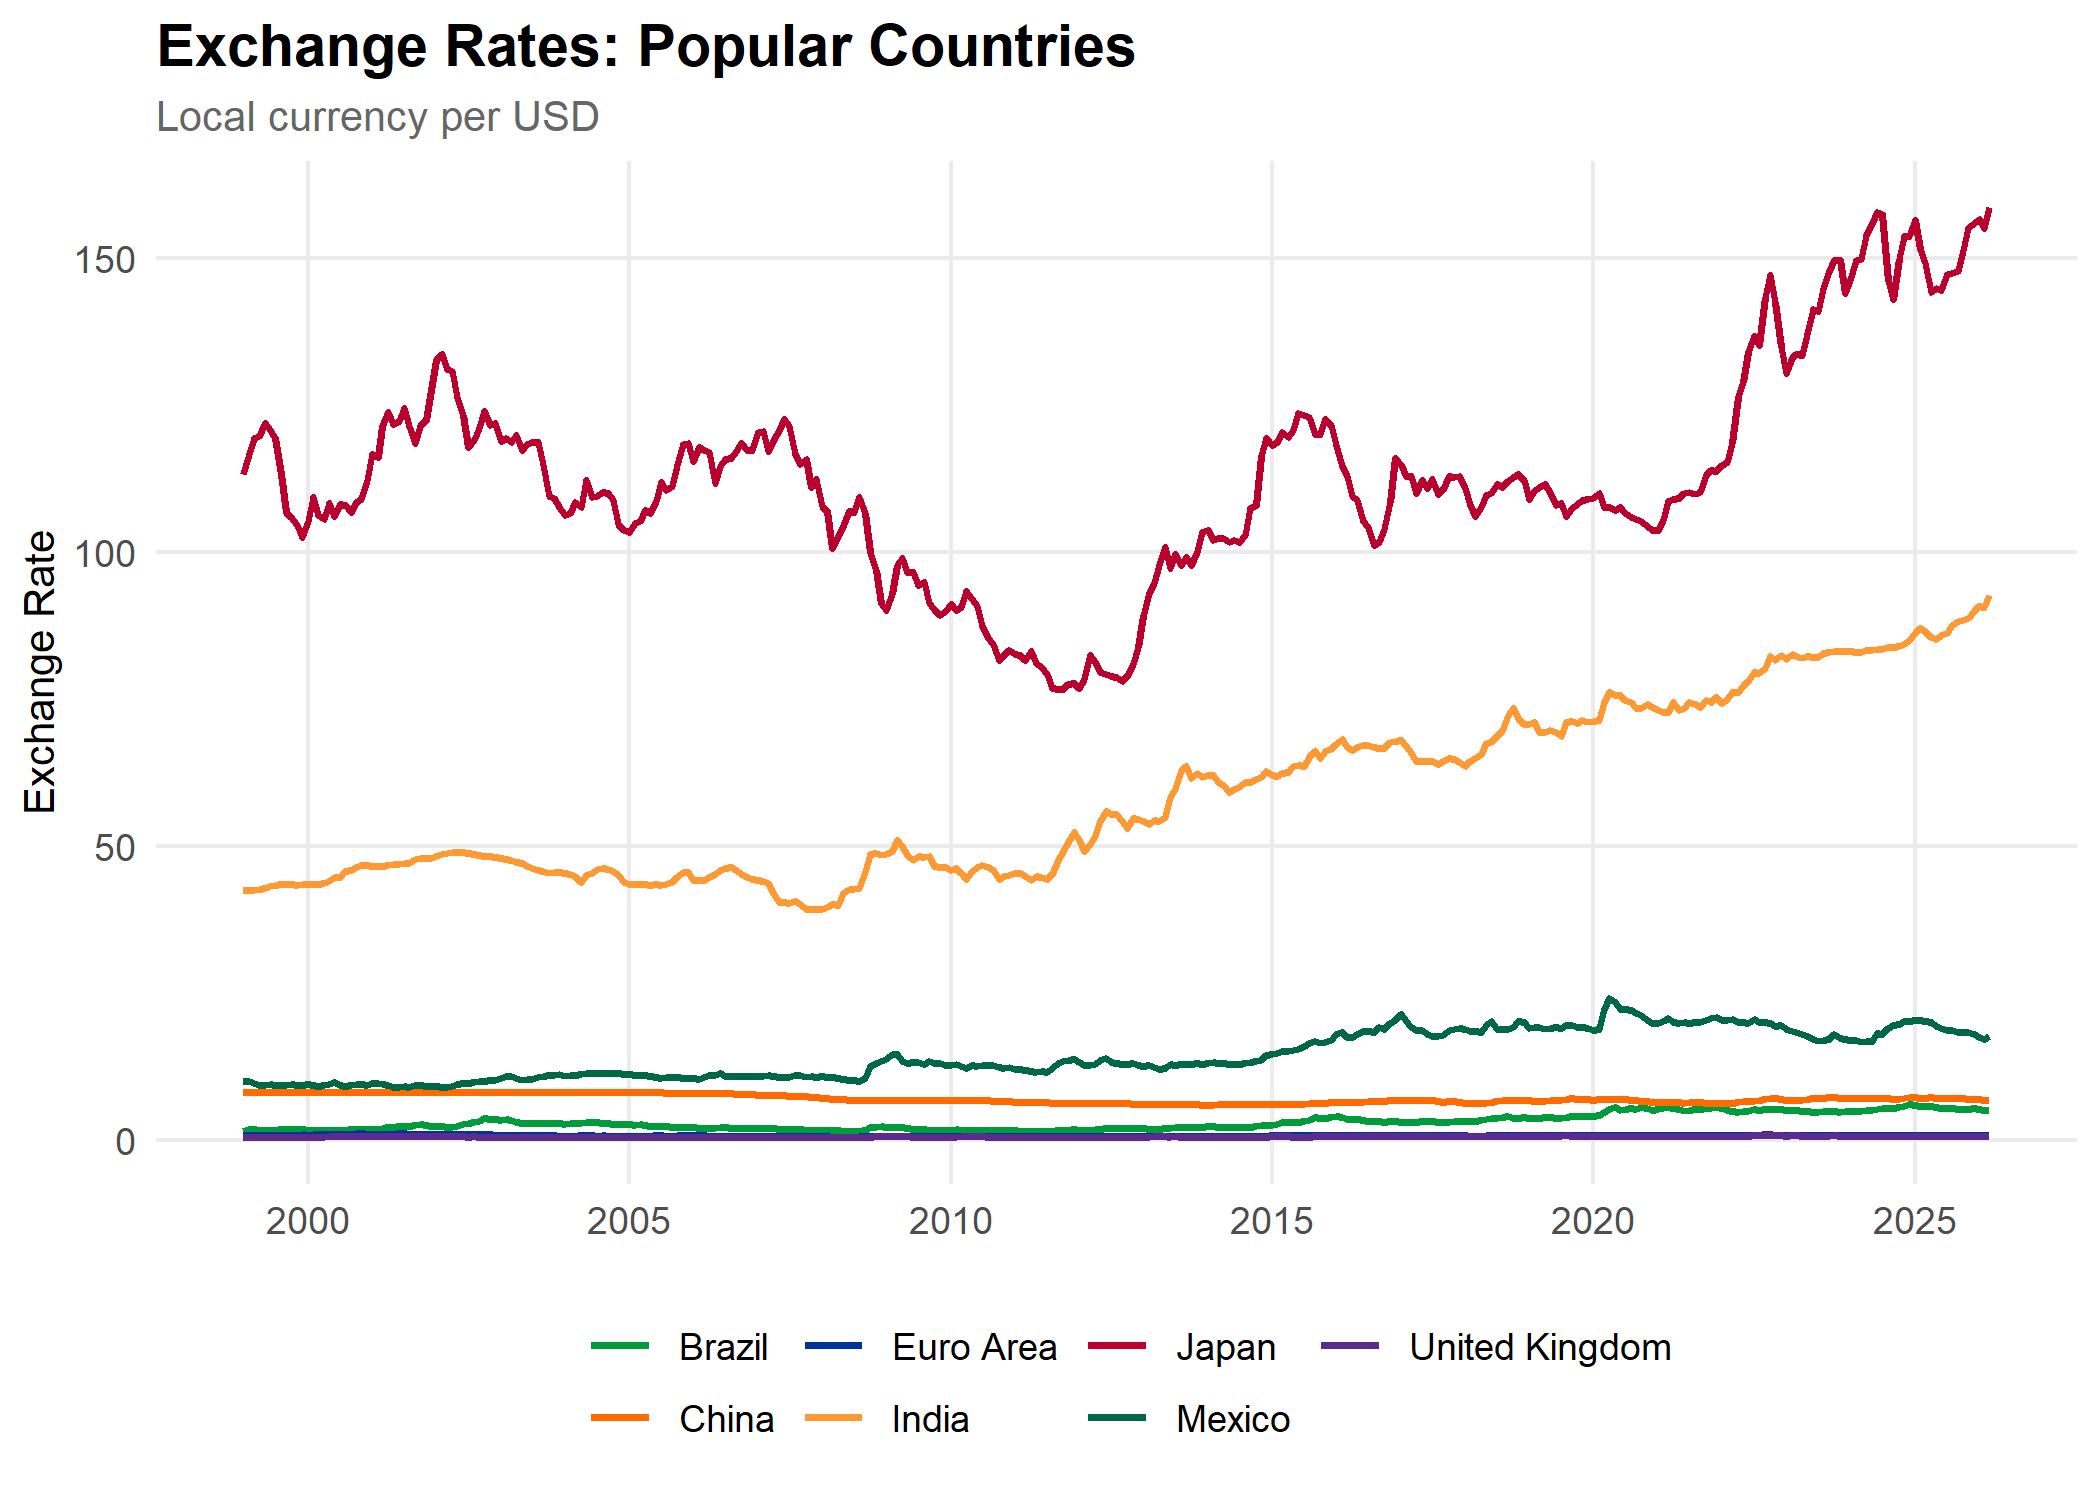
A Note on Data Normalization
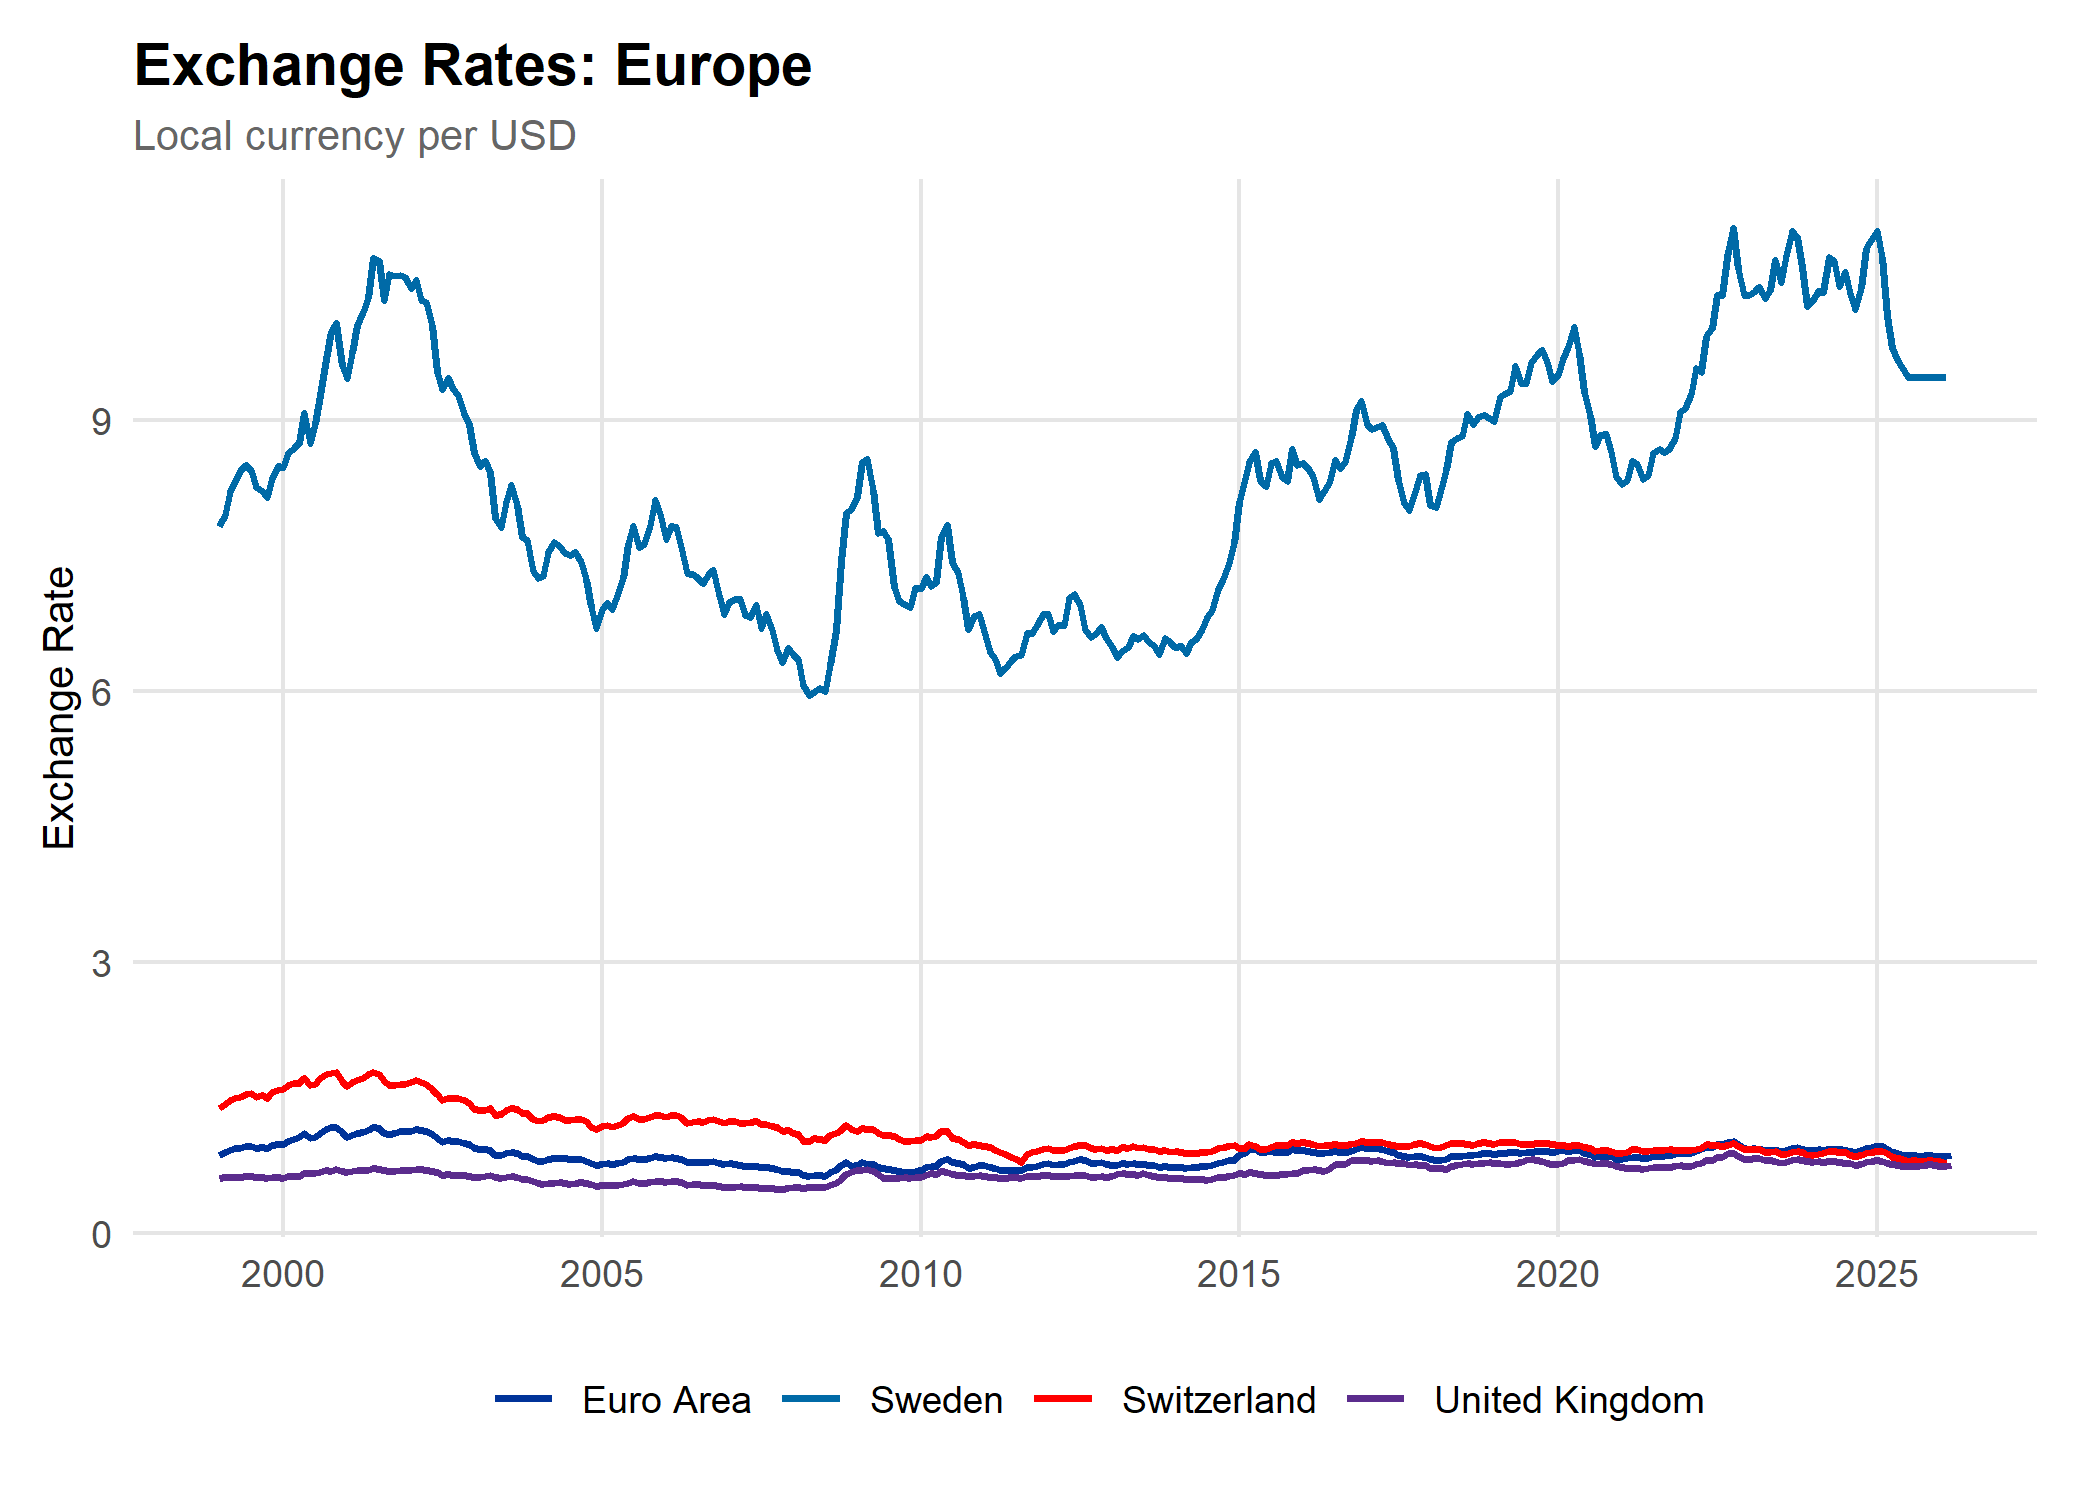
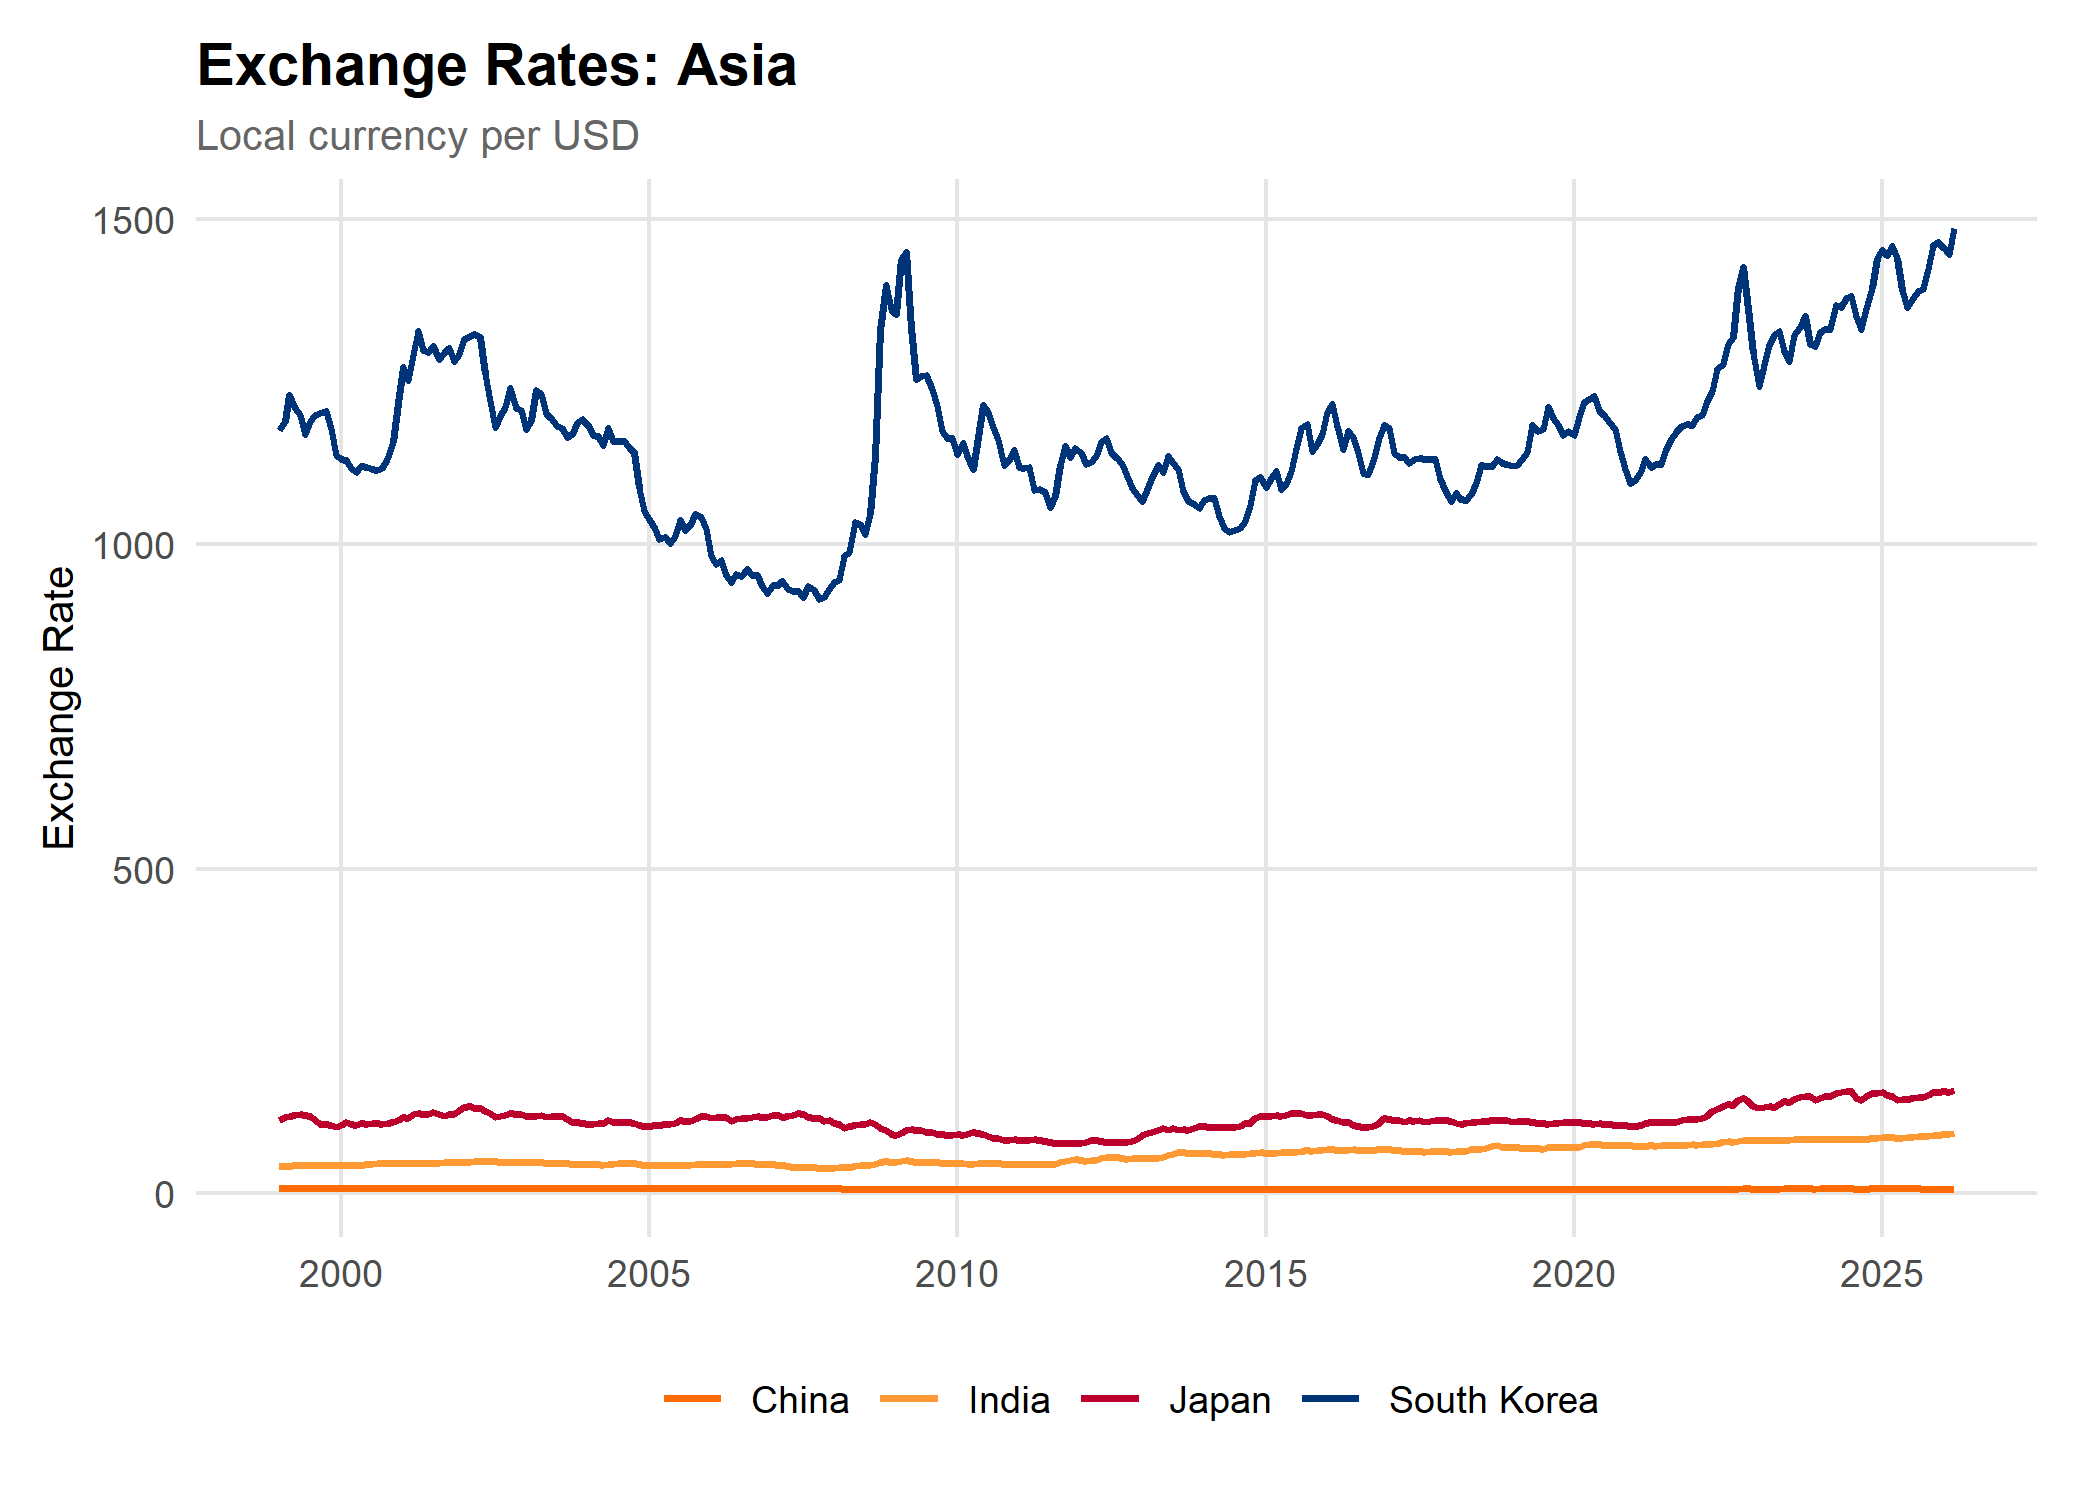
Looking at individual exchange rate charts is useful for tracking the history of a single currency in isolation. The problem arises when you try to compare currencies side by side. The Yen has traded between roughly 100 and 160 per dollar. The Peso has ranged from about 9 to 25. The Euro has hovered between 0.65 and 1.20. These are not comparable numbers — plotting them on the same y-axis produces a chart that is nearly unreadable, with currencies of larger absolute values crowding out everything else.
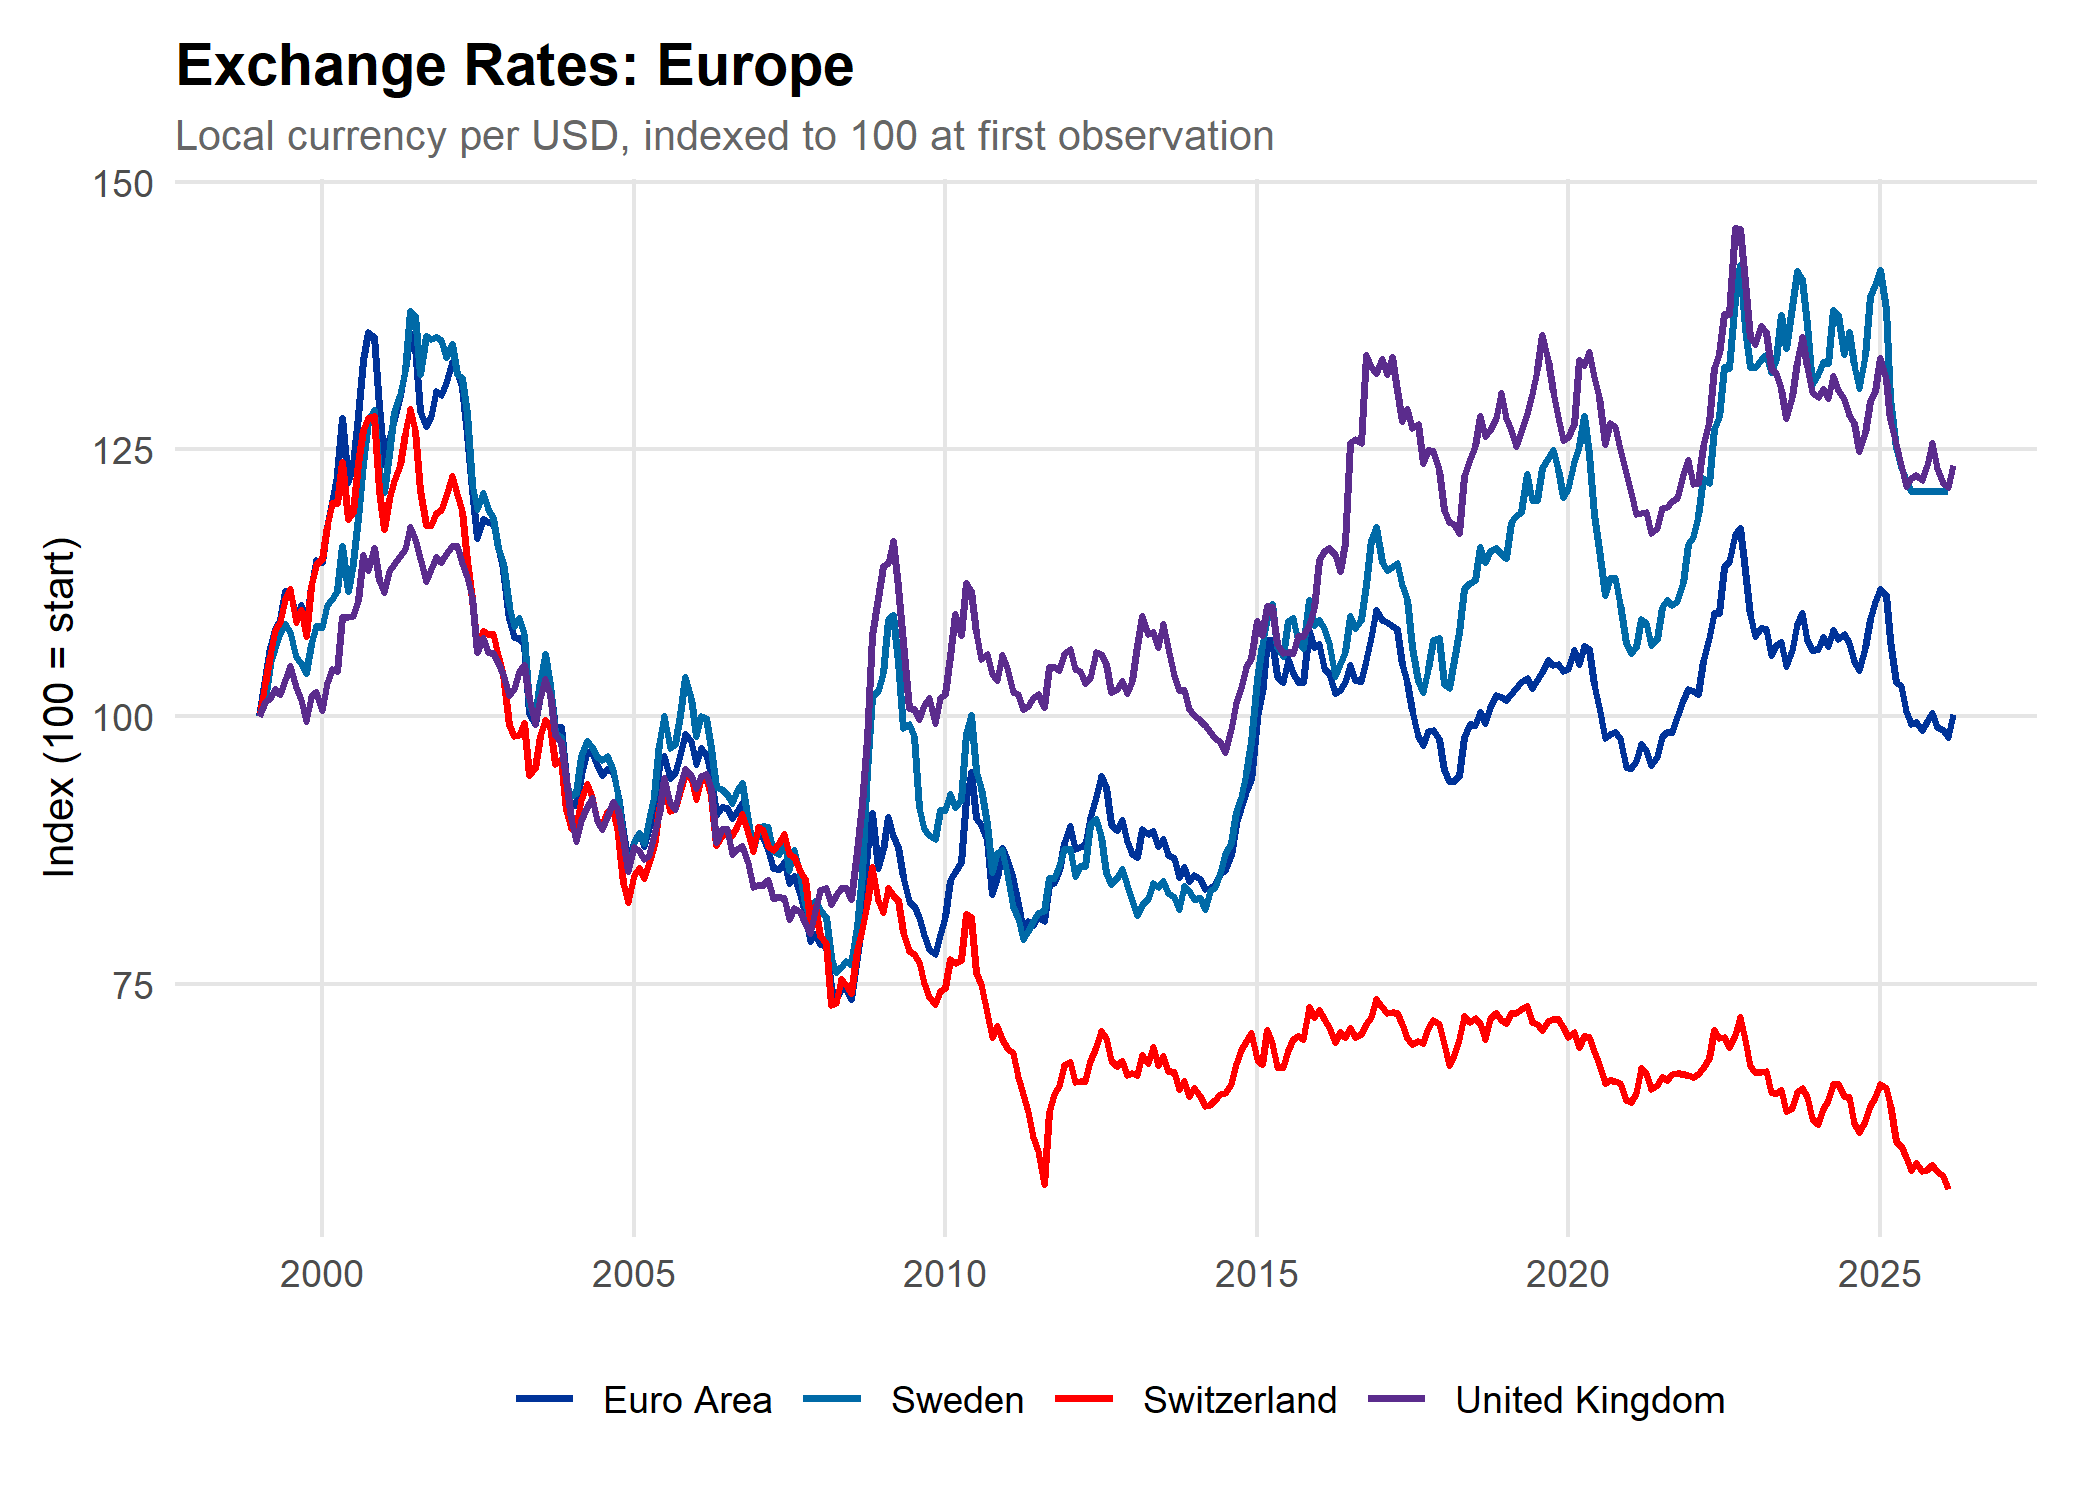
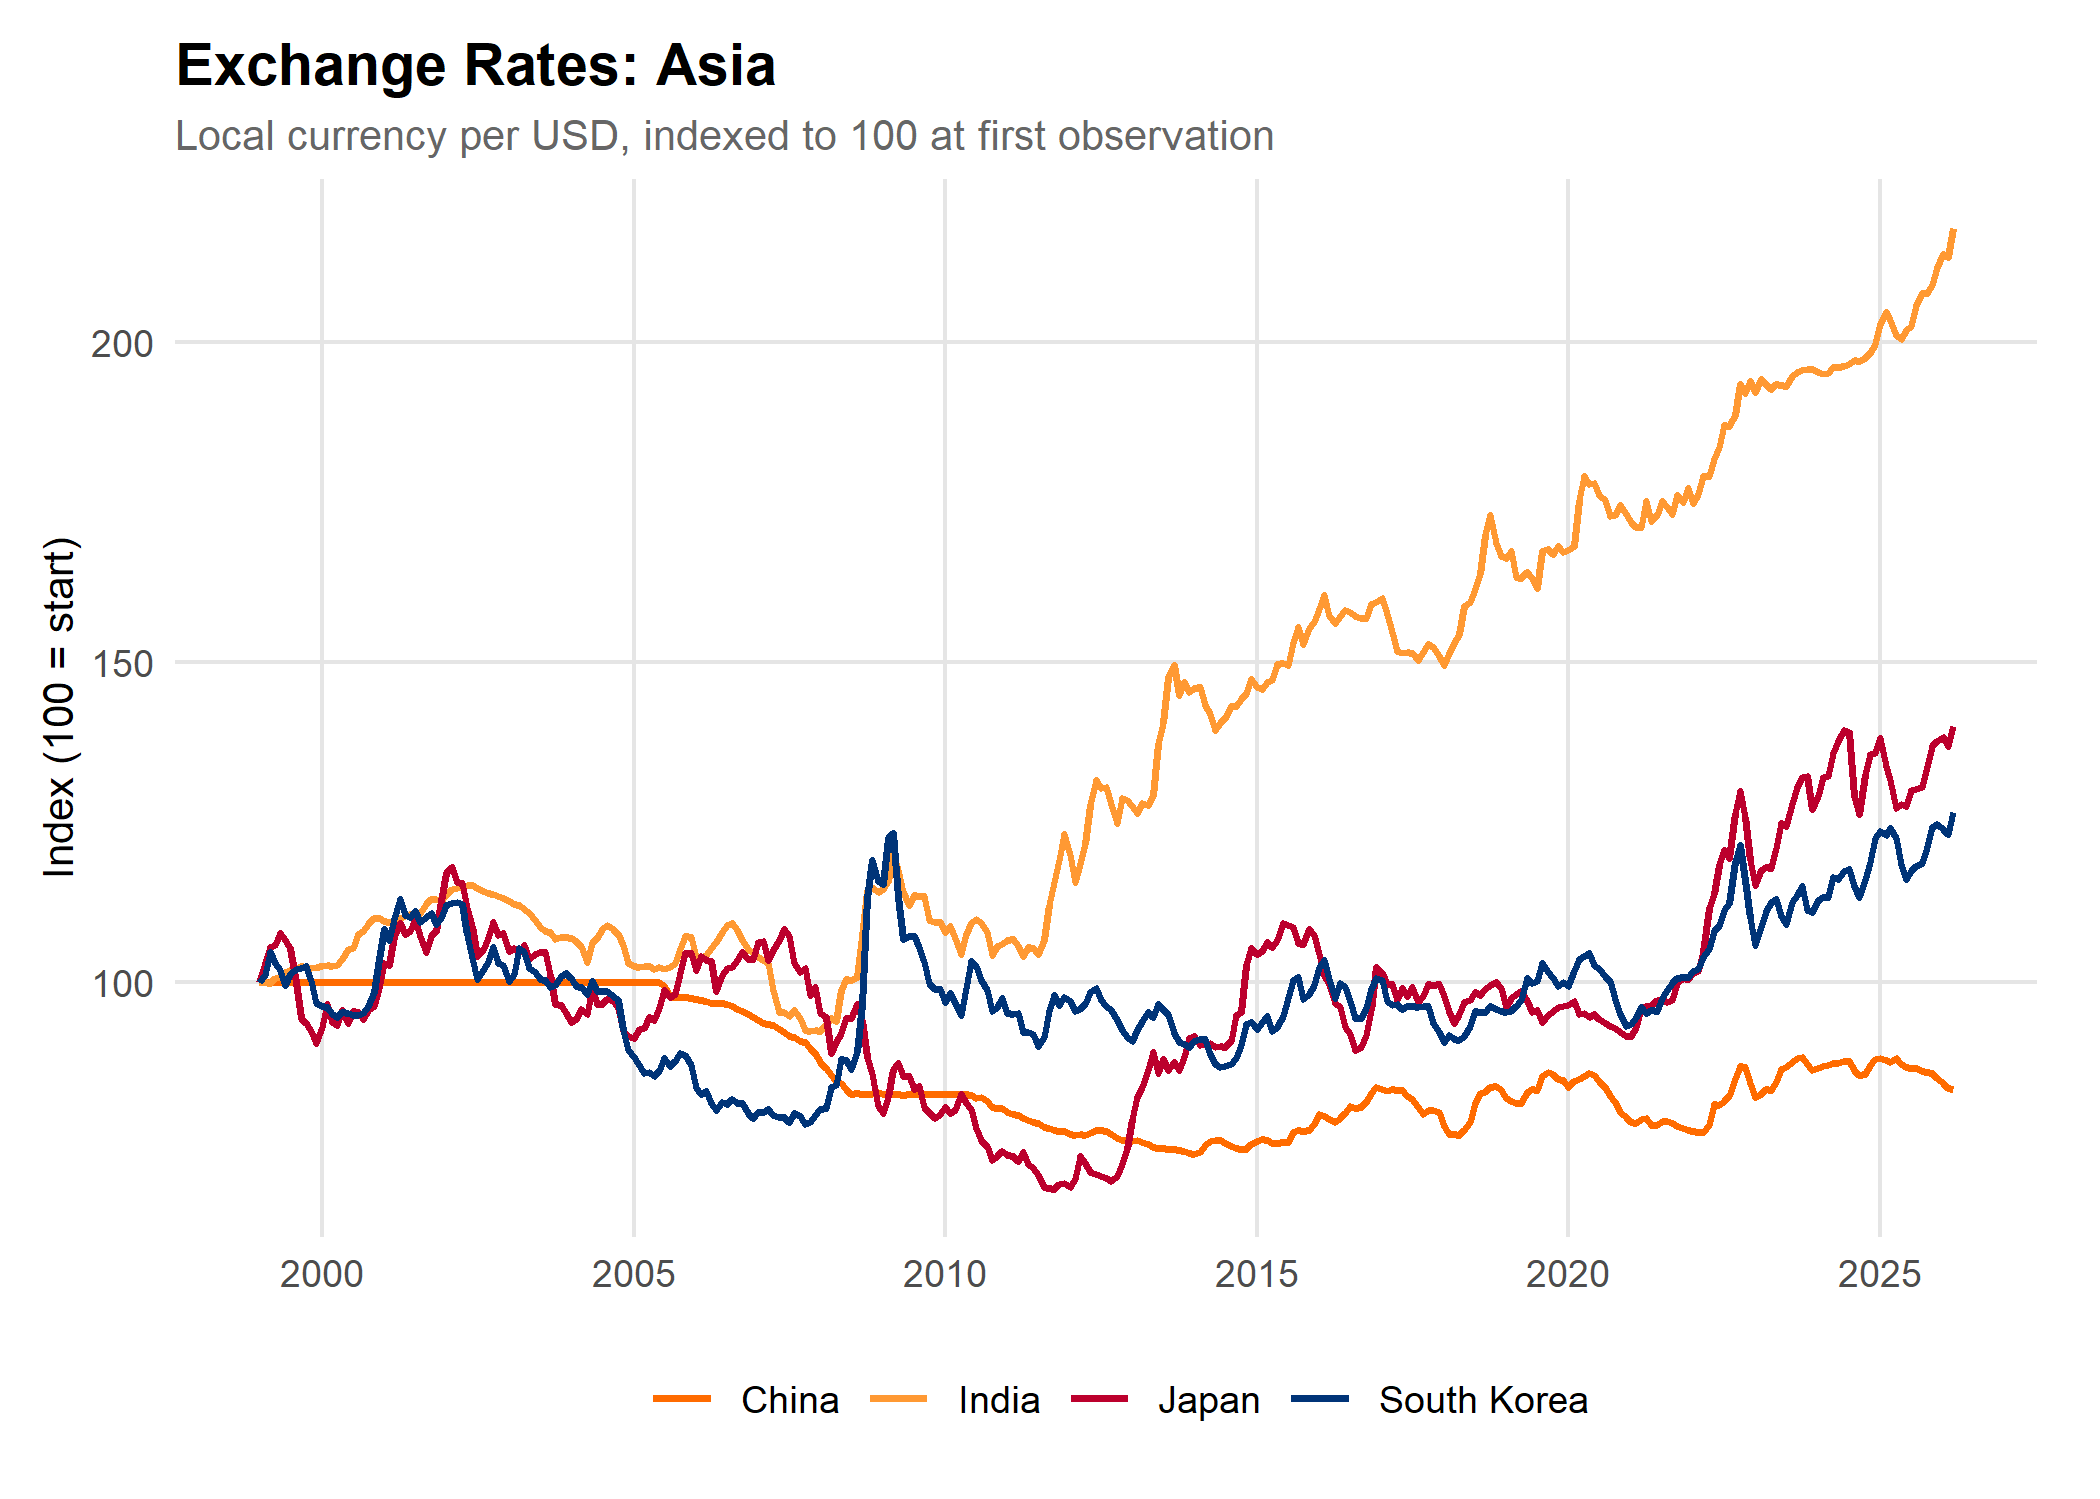
The indexing method used throughout this analysis is straightforward: each currency's first observed value is assigned an index of 100. Every subsequent observation is expressed as a percentage of that starting value. An indexed value above 100 means the dollar buys more of that currency than it did at the starting point — good for American travelers. A value below 100 means it buys less.
The chart above makes the problem plain. Japan dominates the y-axis entirely, and every other currency is compressed into an unreadable band at the bottom. This is why we index.
The index doesn't change the underlying exchange rate data; it simply rescales it so that all currencies start at the same point, making their trajectories directly comparable regardless of how many units per dollar each currency originally trades at. Exchange rate data is sourced from the Federal Reserve Bank of St. Louis (FRED), using monthly averages throughout.
Europe: Four Currencies, One Story — Until It Isn't
The four European currencies in this analysis — the Euro, the Swedish Kronor, the Swiss Franc, and the British Pound — all trade within a relatively tight range against the dollar. With the data indexed, a far more compelling story emerges. The early 2000s were a period of genuine dollar strength across Europe, consistent across all four currencies. This wasn't coincidental: the late 1990s tech boom had drawn massive capital flows into the United States. When the dot-com bubble burst in 2000 — erasing trillions in equity value and sending the NASDAQ down roughly 78% from its peak — those capital flows reversed, and the dollar gave back much of its gains across Europe over the following years.
The decline continued through the 2008 housing crisis. When the housing market collapsed and the global financial system seized up, the dollar actually strengthened briefly — not because the US was in good shape, but because panicked investors around the world liquidated foreign assets and rushed into US Treasury securities as a safe haven. That spike is visible in the indexed data as a momentary uptick before European currencies resumed their recoveries.
Swiss Franc
Only European currency with persistent, structural appreciation vs. the dollar
Kronor & Pound
Both weakened in net terms — Americans get more per dollar today than in 1999
Euro
Roughly returned to its 1999 starting level after wide oscillation
Currency-by-Currency Breakdown
The Swiss Franc is the most dramatic case — it has continued a long, persistent appreciation against the dollar that began around 2001 and has never fully reversed. An American visiting Switzerland today gets meaningfully fewer francs per dollar than at any point in this dataset. The Euro, Pound, and Kronor have all oscillated within a wide band — weaker in some periods, stronger in others — but none have experienced the same relentless one-direction trend as the Franc.
COVID produced a sharp but relatively short-lived dollar weakness across Europe in 2020, as the Federal Reserve slashed rates to zero and flooded the financial system with liquidity. Three rounds of direct stimulus payments totaling nearly $931 billion, plus broader relief packages, contributed roughly 2.6 percentage points of excess inflation by early 2022 — a demand surge that weakened the dollar internationally even as it temporarily boosted domestic spending.
In the big picture, this 26-year dataset reveals three distinct trajectories across Europe. The Kronor and Pound have both weakened against the dollar in net terms. The Euro has roughly returned to where it started. And the Swiss Franc stands alone as the currency that has structurally and persistently appreciated against the dollar, making Switzerland meaningfully more expensive for Americans today than a generation ago.
Latin America: Boom, Bust, and Political Turbulence
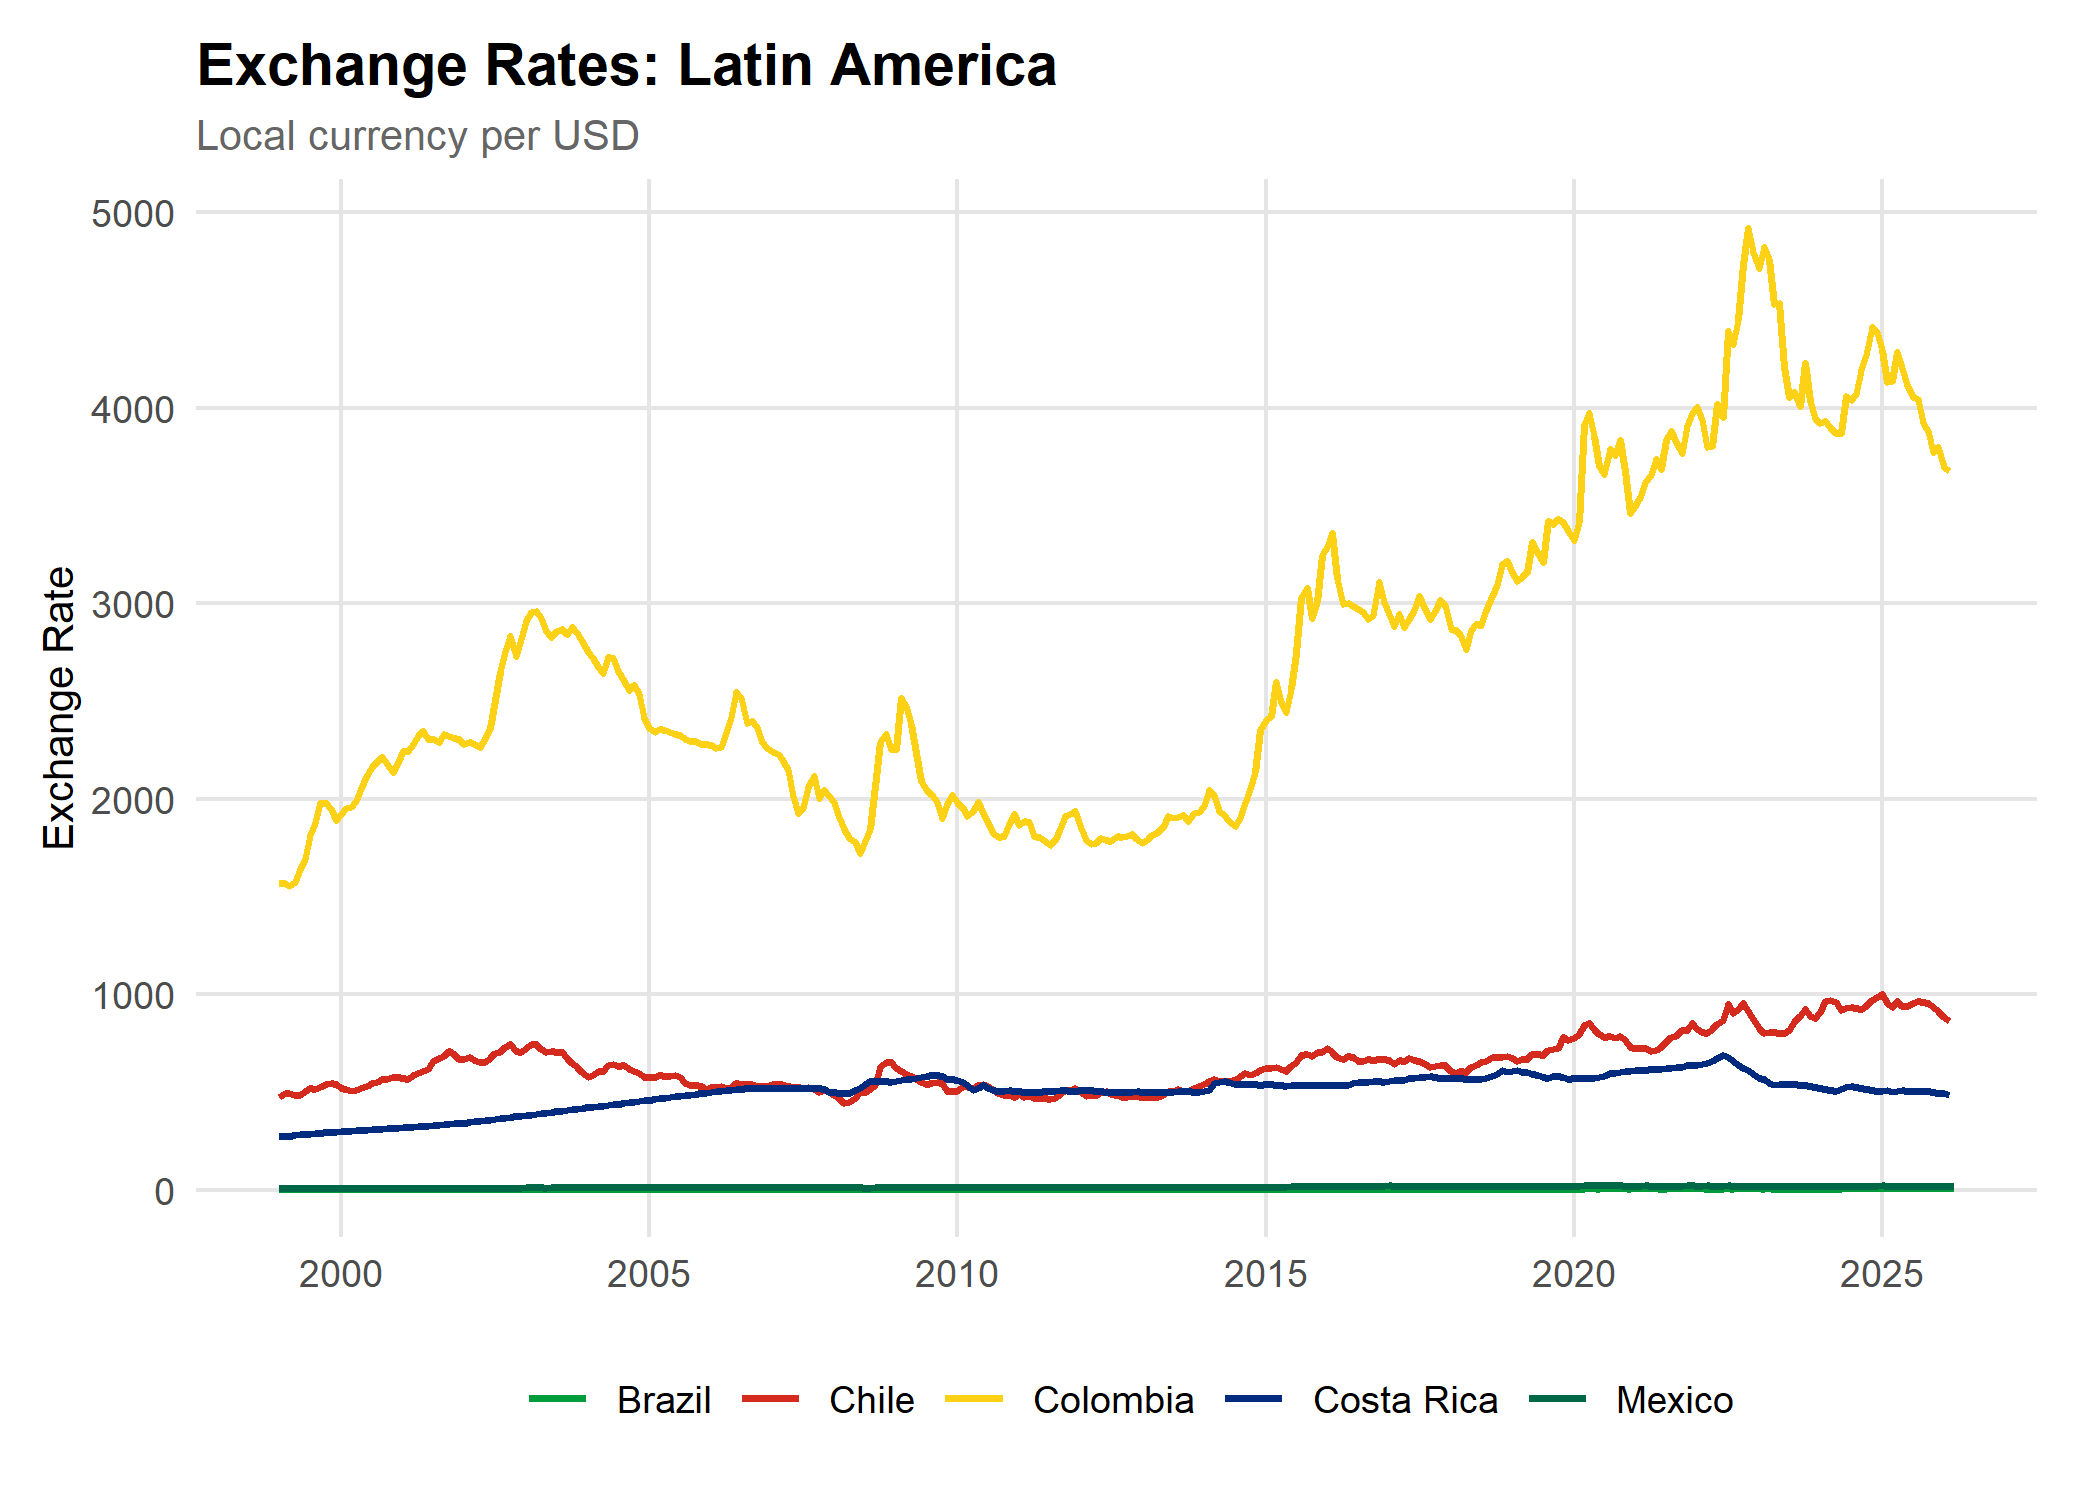
The five currencies in this region — the Brazilian Real, Mexican Peso, Chilean Peso, Colombian Peso, and Costa Rican Colón — span vastly different scales, from the Colombian Peso trading above 2,000 per dollar to the Brazilian Real above 5 per dollar. This makes the raw exchange rate chart even more difficult to interpret than Europe's, reinforcing exactly why the indexed view matters so much for this region.
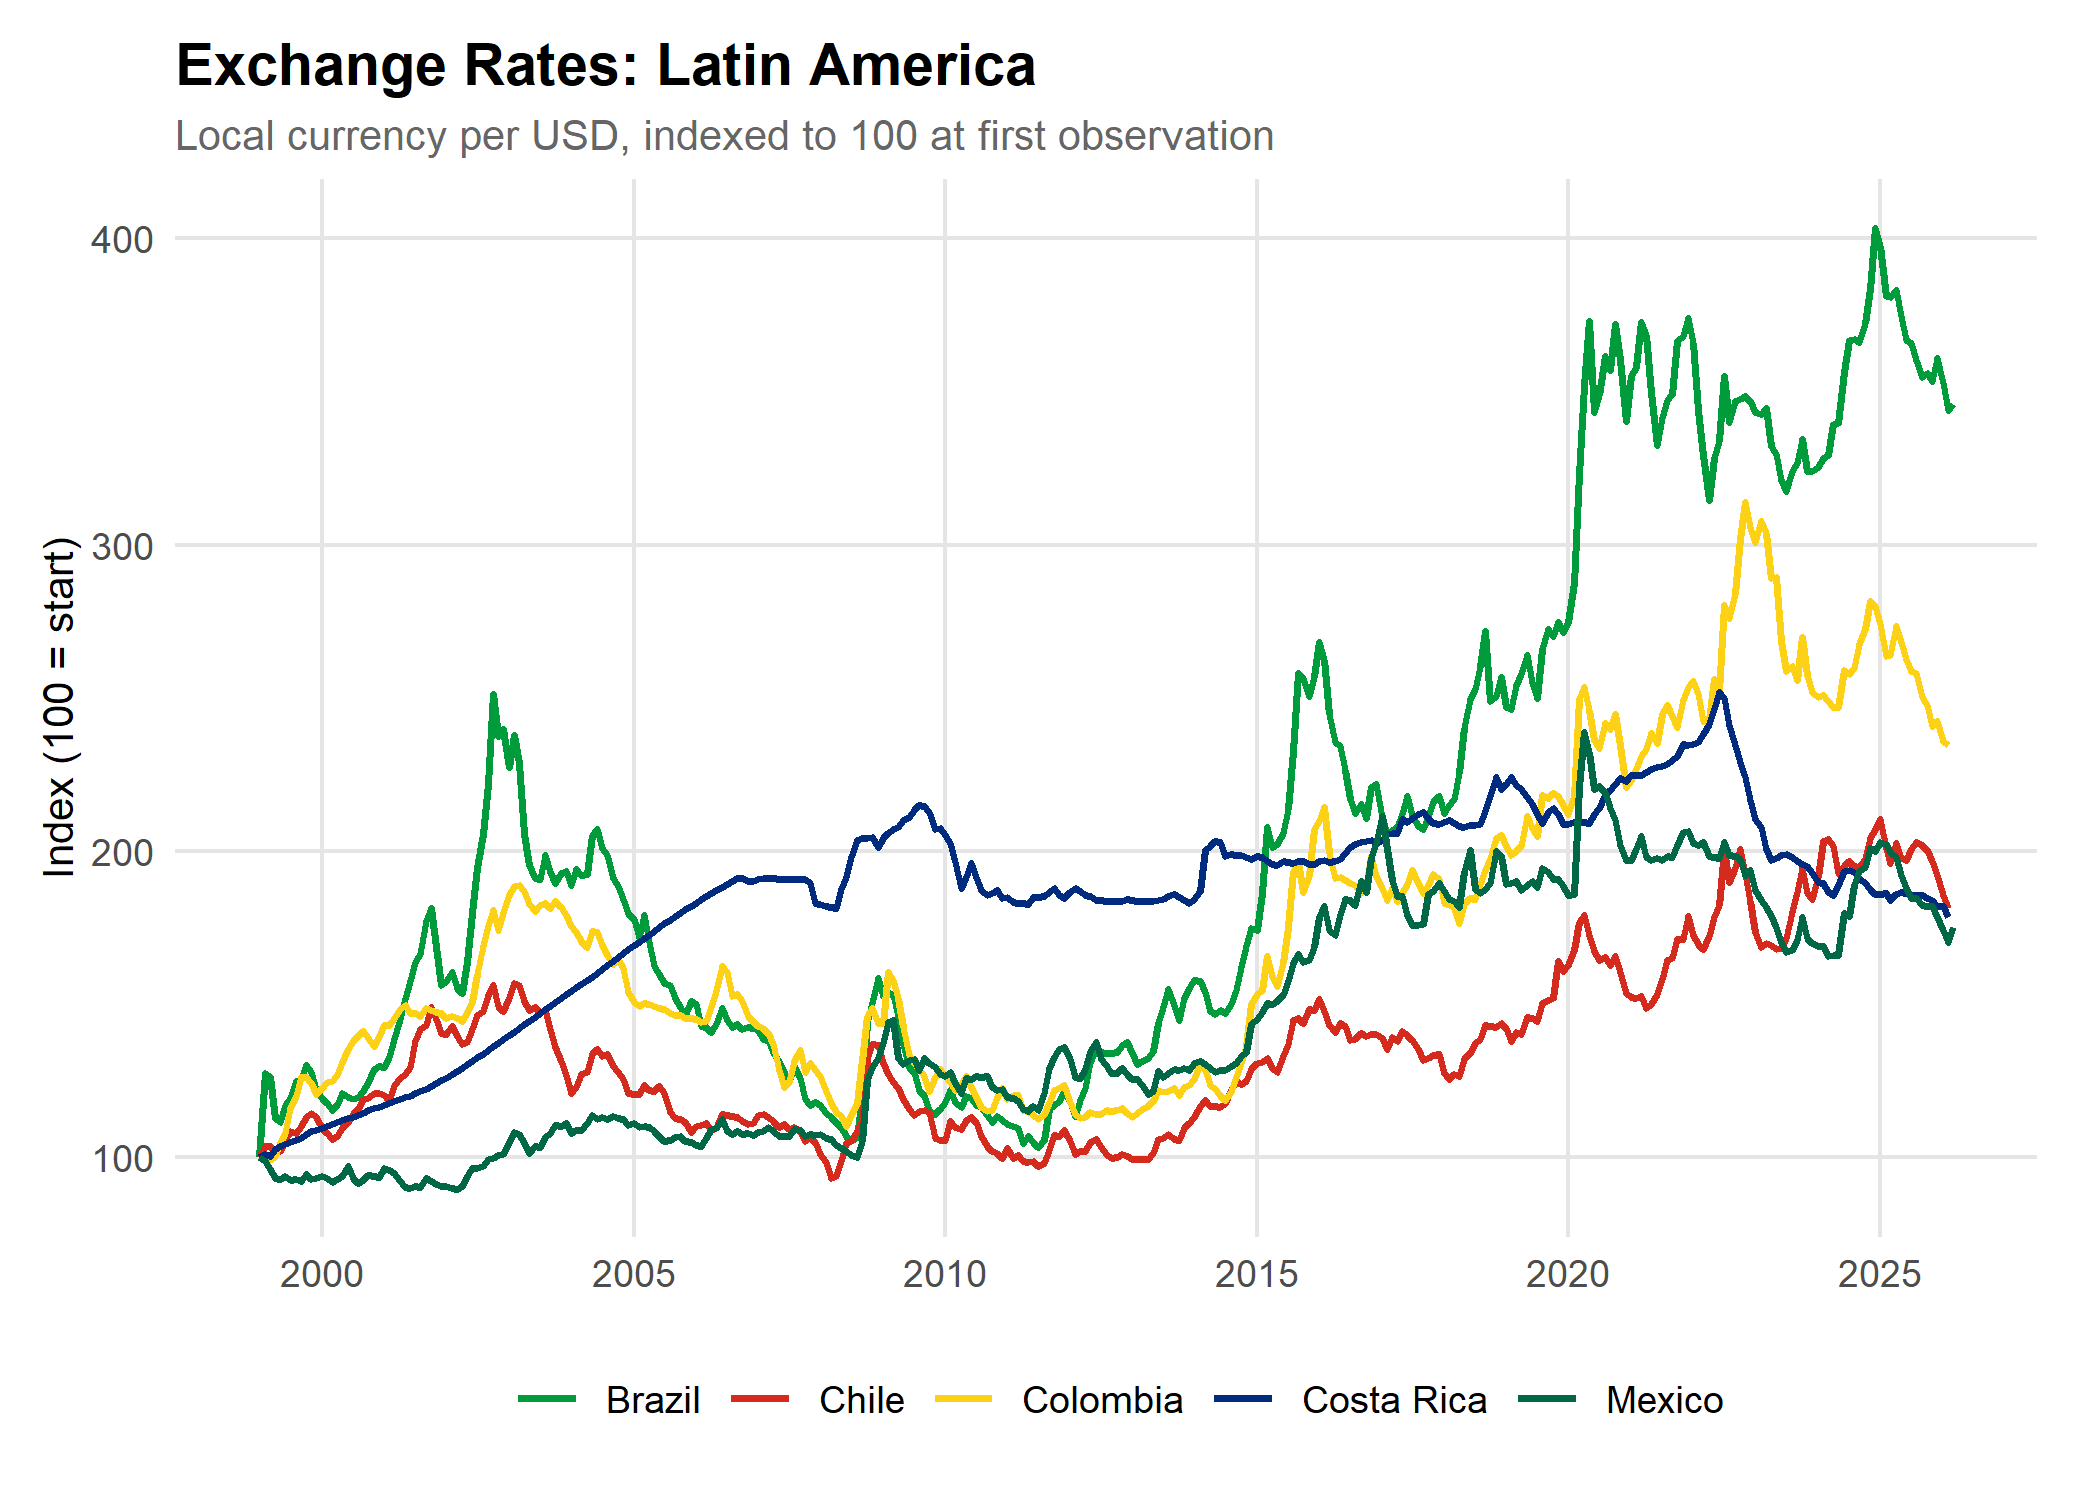
With the data indexed, the story becomes far richer. The early 2000s were a period of broad dollar strength across Latin America — the same dot-com-era capital flows at work in Europe, compounded by the region's own structural vulnerabilities to US interest rate cycles and commodity price swings.
Slow, consistent depreciation — least volatile in region
Notable Stories
Brazil stands out as the most volatile currency by a wide margin. Its indexed value climbed steeply in the early 2000s around Lula's first presidential election — when markets feared a sharp left turn in fiscal policy — then staged a remarkable recovery through the commodity super-cycle of the mid-2000s. That recovery reversed sharply after 2014, culminating in the impeachment of President Dilma Rousseff in 2016 and the Petrobras corruption scandal.
Chile's Peso is particularly interesting: it has benefited visibly in recent years from elevated copper prices, which dominate Chilean exports and act as a natural currency backstop. When global copper demand rises — as it has during the energy transition buildout — the Peso tends to firm up, partially reversing the long-term depreciation trend.
The Costa Rican Colón is a notable exception to the regional pattern of episodic crises and sharp reversals. It has followed a slow, consistent depreciation path since 1999 — no sudden spikes, no dramatic recoveries — reflecting Costa Rica's comparatively stable macroeconomic fundamentals and the buffering effect of its substantial dollar-denominated tourism and tech export revenues.
Asia: The Biggest Range, The Most Divergent Stories
Asia presents the most extreme version of the scale problem seen across all three regions. Japan's Yen trades at roughly 150 per dollar, South Korea's Won at over 1,400, and India's Rupee near 85 — while China's Yuan hovers close to 7. The indexed view reveals four genuinely distinct stories — more divergence than either the Europe or Latin America charts produce.
Currency
Key Feature
Long-Run Trend vs. Dollar
Japanese Yen
Most volatile; BoJ policy divergence
Multi-decade lows in early 2020s; now showing signs of recovery
Chinese Yuan
Government-managed peg until 2005
Modest net appreciation; tightly managed by PBoC
Indian Rupee
Structural inflation differential
Slow, steady depreciation — India progressively more affordable for Americans
South Korean Won
Deep global trade integration
Meaningful depreciation; far more volatile than Rupee
The Japan Story
Japan's Yen is the most volatile of the four in indexed terms, and the swings are large enough to matter enormously for American travelers. The Yen strengthened sharply after the 2008 crisis, driven by the classic safe-haven dynamic. That strength reversed dramatically after 2013, when Prime Minister Shinzo Abe's government launched "Abenomics" — centered on aggressive monetary easing that deliberately weakened the yen to boost export competitiveness. The Yen never fully recovered and has been trending weaker since, hitting multi-decade lows in the early 2020s as the Bank of Japan held rates near zero while every other major central bank hiked aggressively to fight post-pandemic inflation.
China's Yuan tells an unusual story. For the first six years of this dataset, the line is almost perfectly flat — China maintained a strict peg of approximately 8.28 yuan per dollar from 1994 until July 2005, when Beijing bowed to sustained international pressure. From 2005 onward, the Yuan appreciated steadily until around 2014, then weakened again as China's growth model came under pressure.
What Does the Future Hold for the US Dollar?
The data presented throughout this analysis tells a story of the past 26 years — but what does the road ahead look like for American travelers? The picture is one of broad but uneven dollar weakness, with meaningful variation by region and by the specific forces driving each local currency.
The Dollar Index (DXY) fell approximately 9.4% in 2025 — its steepest single-year decline since 2017 — driven by the Federal Reserve's rate-cutting cycle, weakening US growth expectations, and a broader reassessment of dollar-denominated assets. ABN AMRO estimates the dollar is roughly 17% overvalued relative to the euro and as much as 40% overvalued relative to the Japanese yen on a purchasing power parity basis.
For Americans traveling to Europe, the outlook is generally unfavorable. The euro is expected to continue strengthening as the interest rate differential between the Fed and the European Central Bank narrows. Germany's major fiscal expansion into infrastructure and defense spending is providing a new growth engine for the euro area. The Swiss Franc — already the worst-performing currency for American travelers in the historical data — is projected to remain strong; ABN AMRO notes the dollar is actually undervalued relative to the franc by about 19% on a purchasing power parity basis.
Latin America: A Mixed Picture Dominated by Politics
Mexico faces meaningful headwinds from the ongoing renegotiation of USMCA, which has created sustained policy uncertainty weighing on foreign direct investment and the Peso. Most forecasts project USD/MXN in the 17.80–19.00 range through 2026. Brazil's central bank hiked rates aggressively in 2025, giving the Real one of the highest nominal yields in the world and providing some support — but a presidential election in October 2026 introduces historical fiscal risk and currency volatility. Chile's Peso has a more favorable near-term outlook than most regional peers, largely due to elevated copper prices, which is not great news for American travelers heading to Santiago or Patagonia.
Asia: The Yen's Potential Comeback
Japan's Yen has been the standout underperformer of the past several years and may be approaching an inflection point. The Bank of Japan raised its policy rate twice in 2025 — the first meaningful hikes since 2007 — bringing the rate to 0.75%. Analysts widely expect further hikes in 2026, which would narrow the interest rate differential with the US that has been the primary driver of Yen weakness. For Americans, this is arguably the most significant development to watch: Japan has been extraordinarily affordable for American travelers over the past two years due to Yen weakness, and that window may be beginning to close.
Final Thoughts
The overarching story of this analysis is that the era of an exceptionally strong US dollar — which made international travel unusually affordable for Americans from roughly 2022 through early 2025 — appears to be fading. The structural case for a weaker dollar in 2026 and beyond rests on narrowing interest rate differentials, dollar overvaluation relative to most major currencies, and a gradual reassessment of US fiscal sustainability. The Federal Reserve's rate path remains the single most important driver: MUFG Research anticipates the Fed cutting rates three times in 2026, projecting EUR/USD ending the year near 1.24 — implying fewer euros per dollar and a meaningfully more expensive trip to Europe.
For Americans planning international travel, particularly to Japan and Europe, the window of favorable exchange rates may be shorter than it appears. The best advice the data can offer is straightforward: if you've been waiting to pull the trigger on that trip to Tokyo or Rome, the math may not get more favorable from here.
Notes & Sources
Exchange rate data sourced from the Federal Reserve Bank of St. Louis (FRED). Monthly averages are used throughout. Series identifiers: DEXUSEU (Euro), DEXMXUS (Mexican Peso), DEXJPUS (Japanese Yen). https://fred.stlouisfed.org
BIS Quarterly Review, Dollar appreciation in 2008: safe haven, carry trades, dollar shortage. Bank for International Settlements, December 2009. https://www.bis.org/publ/qtrpdf/r_qt0912i.pdf
U.S. Government Accountability Office, Stimulus Checks: Direct Payments to Individuals during the COVID-19 Pandemic (April 2022). https://www.gao.gov/products/gao-22-106044
The Real lost roughly 30% of its value in the months surrounding the 2002 Brazilian presidential election, reflecting investor anxiety about Lula's campaign promises. The currency recovered after Lula's government signaled commitment to fiscal discipline. See: International Monetary Fund, Brazil: 2003 Article IV Consultation (2003).
The 1997–98 Asian financial crisis began with Thailand's currency collapse and spread rapidly to South Korea, Indonesia, and other economies. South Korea required a $58 billion IMF bailout — at the time the largest in IMF history. The Won lost roughly half its value in a matter of months. See: International Monetary Fund, The Asian Crisis: Causes and Cures, Finance & Development, June 1998.
U.S. Treasury Department, Report to Congress on International Economic and Exchange Rate Policies (2005). The Treasury had repeatedly declined to formally label China a currency manipulator, but the political pressure contributed to China's July 2005 decision to revalue the yuan by 2.1% and shift to a managed float. https://home.treasury.gov/system/files/206/2005-11-ForeignExchangeReport.pdf
BIS Quarterly Review, Dollar appreciation in 2008: safe haven, carry trades, dollar shortage. Bank for International Settlements, December 2009. https://www.bis.org/publ/qtrpdf/r_qt0912i.pdf
Bank of Japan, Introduction of "Quantitative and Qualitative Monetary Easing" (April 2013). The BoJ announced it would double Japan's monetary base within two years, which contributed to the yen declining more than 30% against the dollar between 2012 and 2015. https://www.boj.or.jp/en/mpc/mpmdeci/mpm_2013/k130404a.pdf